Fig. 6.
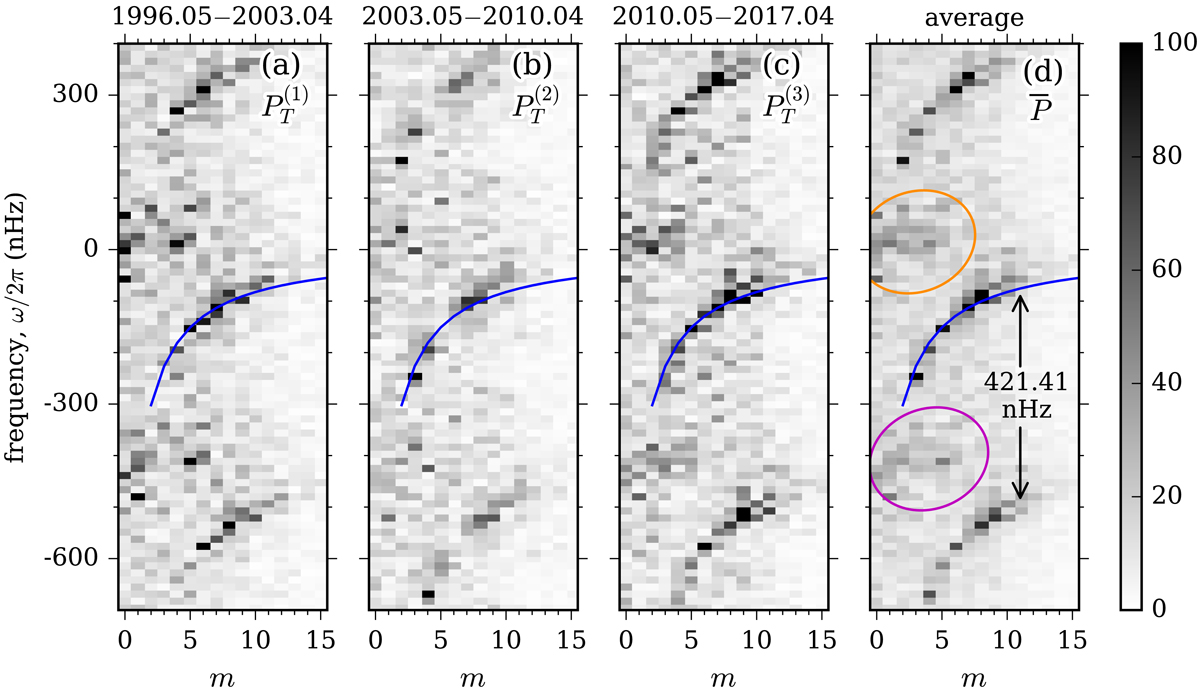
Power spectra of south-north travel-time shifts measured in the frame rotating at Ωeq/2π = 453.1 nHz. Panels a–c: ![]() from three time periods. Panel d: mean spectrum
from three time periods. Panel d: mean spectrum ![]() from an average of the three
from an average of the three ![]() (seven years each). The blue lines highlight the dispersion relation of the classical Rossby waves described in Eq. (1) with ℓ = m and Ω = Ωeq. The orange ellipse marks the excess low-frequency power at low m and the purple ellipse marks the spectral leakage from the low-frequency power. The gray scale is the same for the four panels and is shown in the color bar on the right. For clarity, the spectra are rebinned in frequency by a factor of three, such that the frequency resolution is 3/T = 13.6 nHz.
(seven years each). The blue lines highlight the dispersion relation of the classical Rossby waves described in Eq. (1) with ℓ = m and Ω = Ωeq. The orange ellipse marks the excess low-frequency power at low m and the purple ellipse marks the spectral leakage from the low-frequency power. The gray scale is the same for the four panels and is shown in the color bar on the right. For clarity, the spectra are rebinned in frequency by a factor of three, such that the frequency resolution is 3/T = 13.6 nHz.
Current usage metrics show cumulative count of Article Views (full-text article views including HTML views, PDF and ePub downloads, according to the available data) and Abstracts Views on Vision4Press platform.
Data correspond to usage on the plateform after 2015. The current usage metrics is available 48-96 hours after online publication and is updated daily on week days.
Initial download of the metrics may take a while.