Fig. 5.
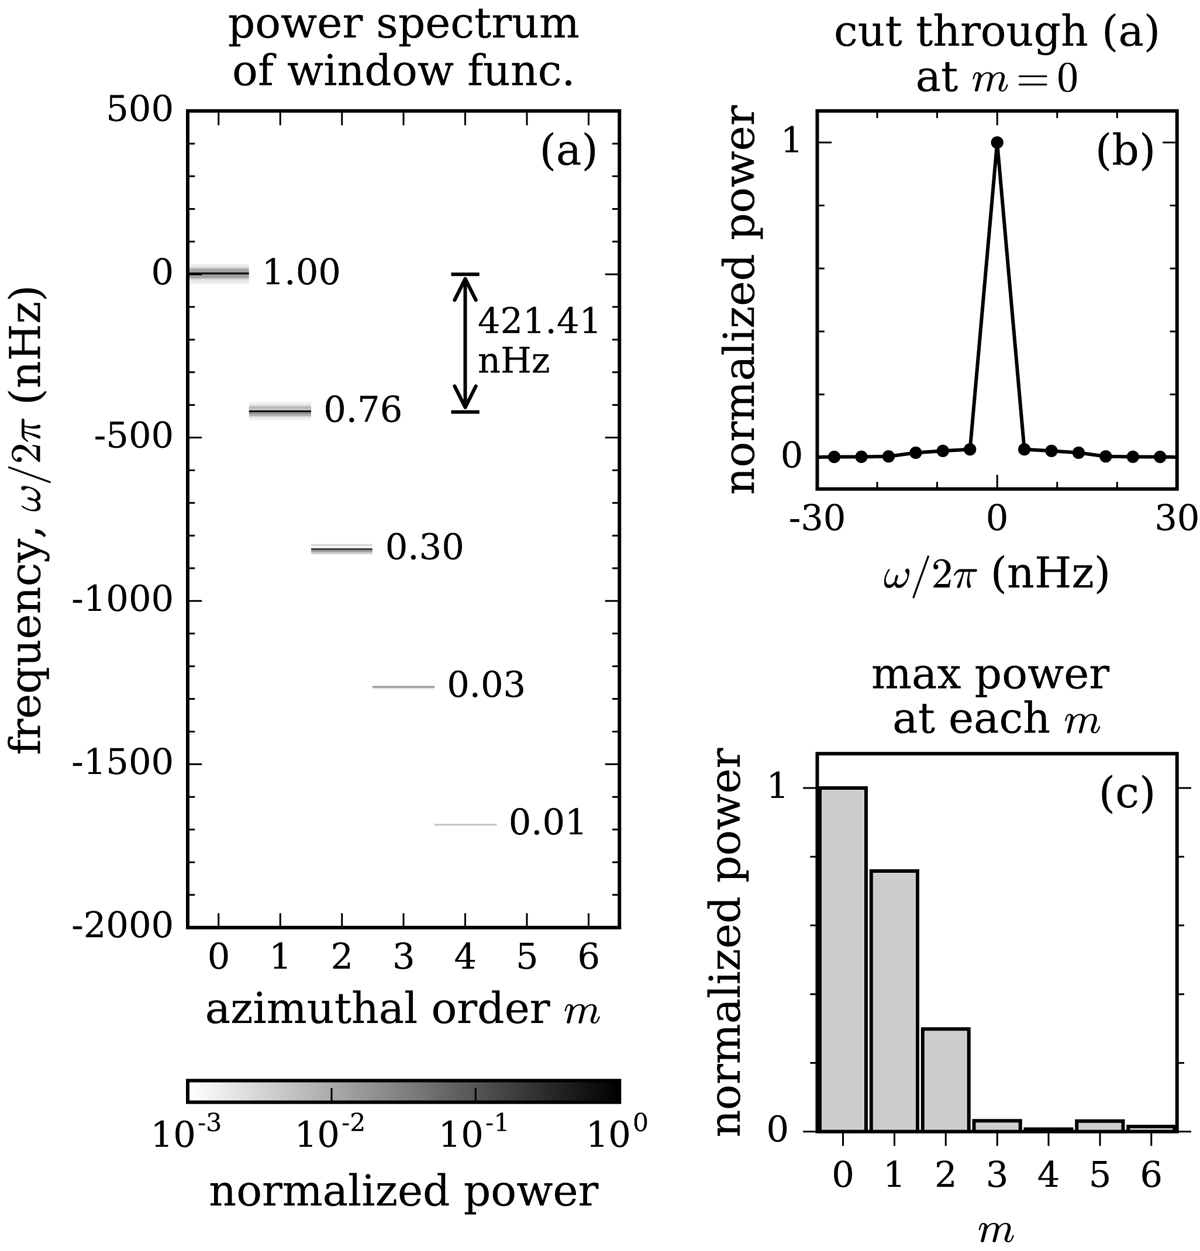
Panel a: mean power spectrum of the window functions ![]() . The power spectrum is normalized to unity at (m, ω) = (0, 0). The maximum value of each peak is written right next to the peak. The frequency offset between the peaks with adjacent m is (Ωeq − Ω⊕)/2π = 421.41 nHz. Panel b: cut at m = 0 through the power spectrum from panel a. Panel c: maximum power of the peaks as a function of m, depicting the spatial leakage.
. The power spectrum is normalized to unity at (m, ω) = (0, 0). The maximum value of each peak is written right next to the peak. The frequency offset between the peaks with adjacent m is (Ωeq − Ω⊕)/2π = 421.41 nHz. Panel b: cut at m = 0 through the power spectrum from panel a. Panel c: maximum power of the peaks as a function of m, depicting the spatial leakage.
Current usage metrics show cumulative count of Article Views (full-text article views including HTML views, PDF and ePub downloads, according to the available data) and Abstracts Views on Vision4Press platform.
Data correspond to usage on the plateform after 2015. The current usage metrics is available 48-96 hours after online publication and is updated daily on week days.
Initial download of the metrics may take a while.