Fig. A.4.
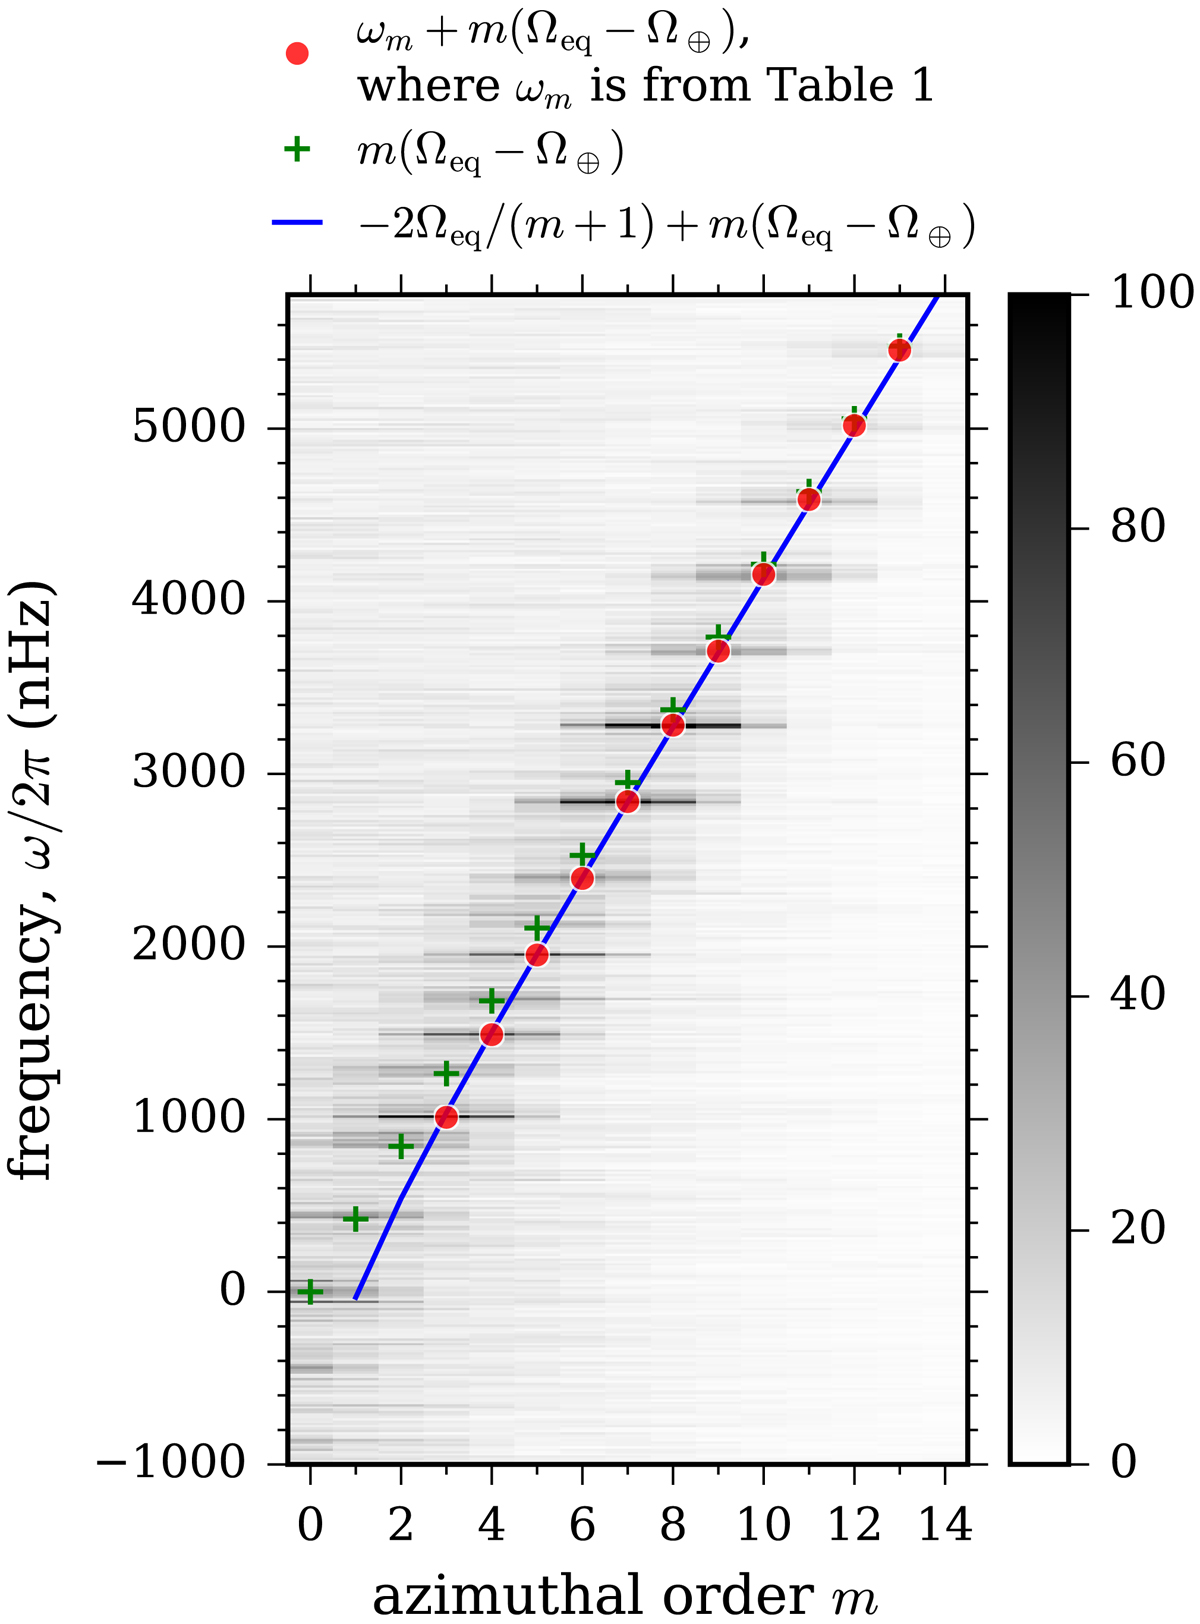
Power spectrum of south-north travel-time shifts computed in the Earth’s frame. The blue line highlights the dispersion relation of sectoral modes of classical Rossby waves in this frame. The mode frequencies (red circles) are shifted by m × 421.41 nHz when measured in the Earth’s frame. The low-frequency power from active regions or convection (near zero frequency at low m in Figs. 6 and 7) is also shifted to m × 421.41 nHz (green crosses) when measured in the Earth’s frame.
Current usage metrics show cumulative count of Article Views (full-text article views including HTML views, PDF and ePub downloads, according to the available data) and Abstracts Views on Vision4Press platform.
Data correspond to usage on the plateform after 2015. The current usage metrics is available 48-96 hours after online publication and is updated daily on week days.
Initial download of the metrics may take a while.