Fig. A.2.
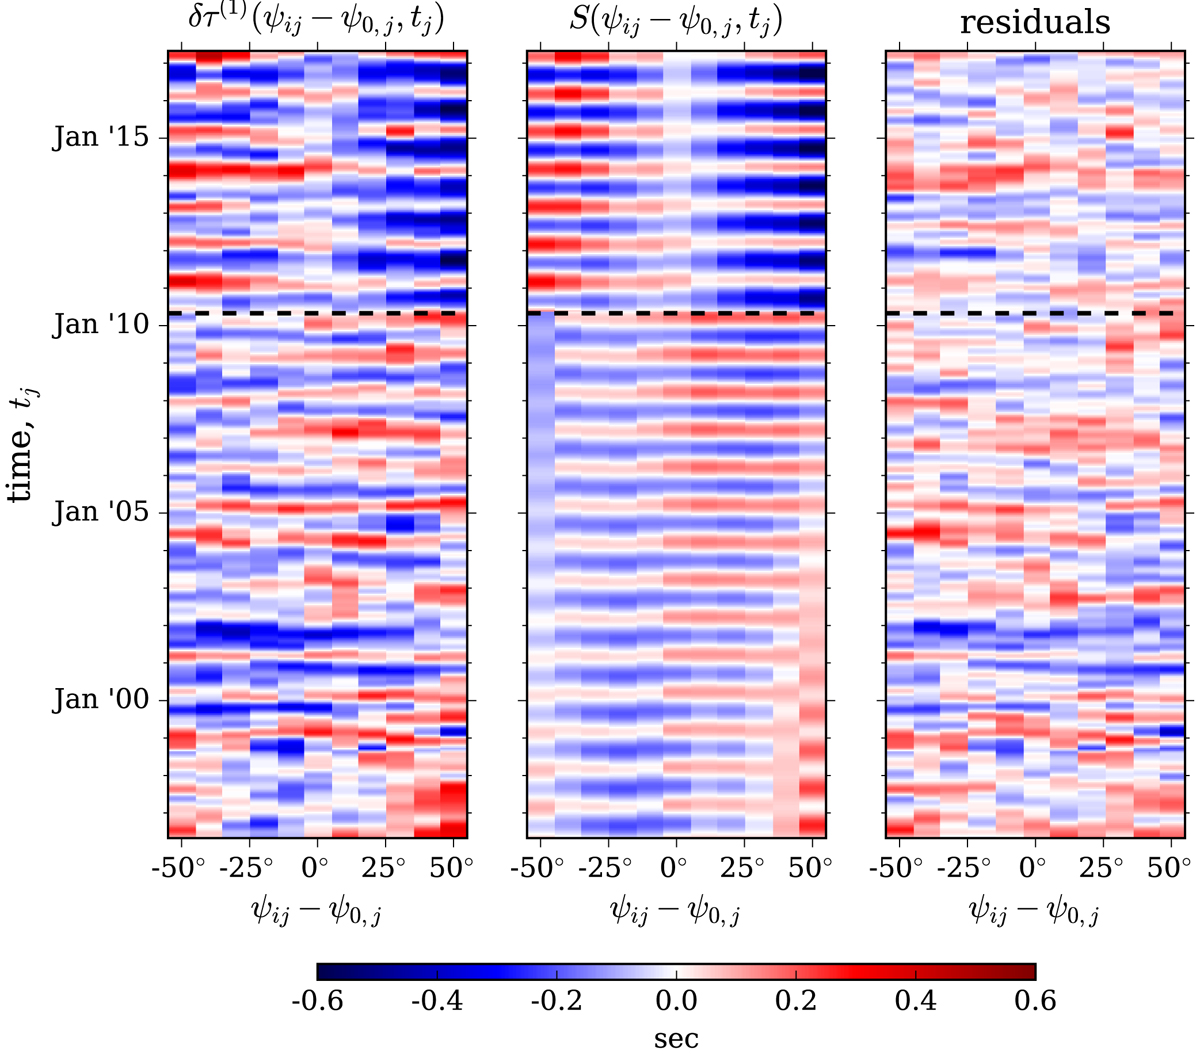
Left: travel-time measurements δτ(1)(ψ′ij, tj), Gaussian smoothed with FWHM = 90 days in time for better visualization, where ψ′ij ≡ ψij − ψ0, j is the separation from the central meridian. Middle: fitted background S(ψ′ij, tj). Right: difference between the two panels on the left. The horizontal dashed lines in all panels indicate the division between the results from MDI and HMI data; the MDI data used in this work span from May 1996 to April 2010 while HMI data span from May 2010 to April 2017.
Current usage metrics show cumulative count of Article Views (full-text article views including HTML views, PDF and ePub downloads, according to the available data) and Abstracts Views on Vision4Press platform.
Data correspond to usage on the plateform after 2015. The current usage metrics is available 48-96 hours after online publication and is updated daily on week days.
Initial download of the metrics may take a while.