Fig. A.1.
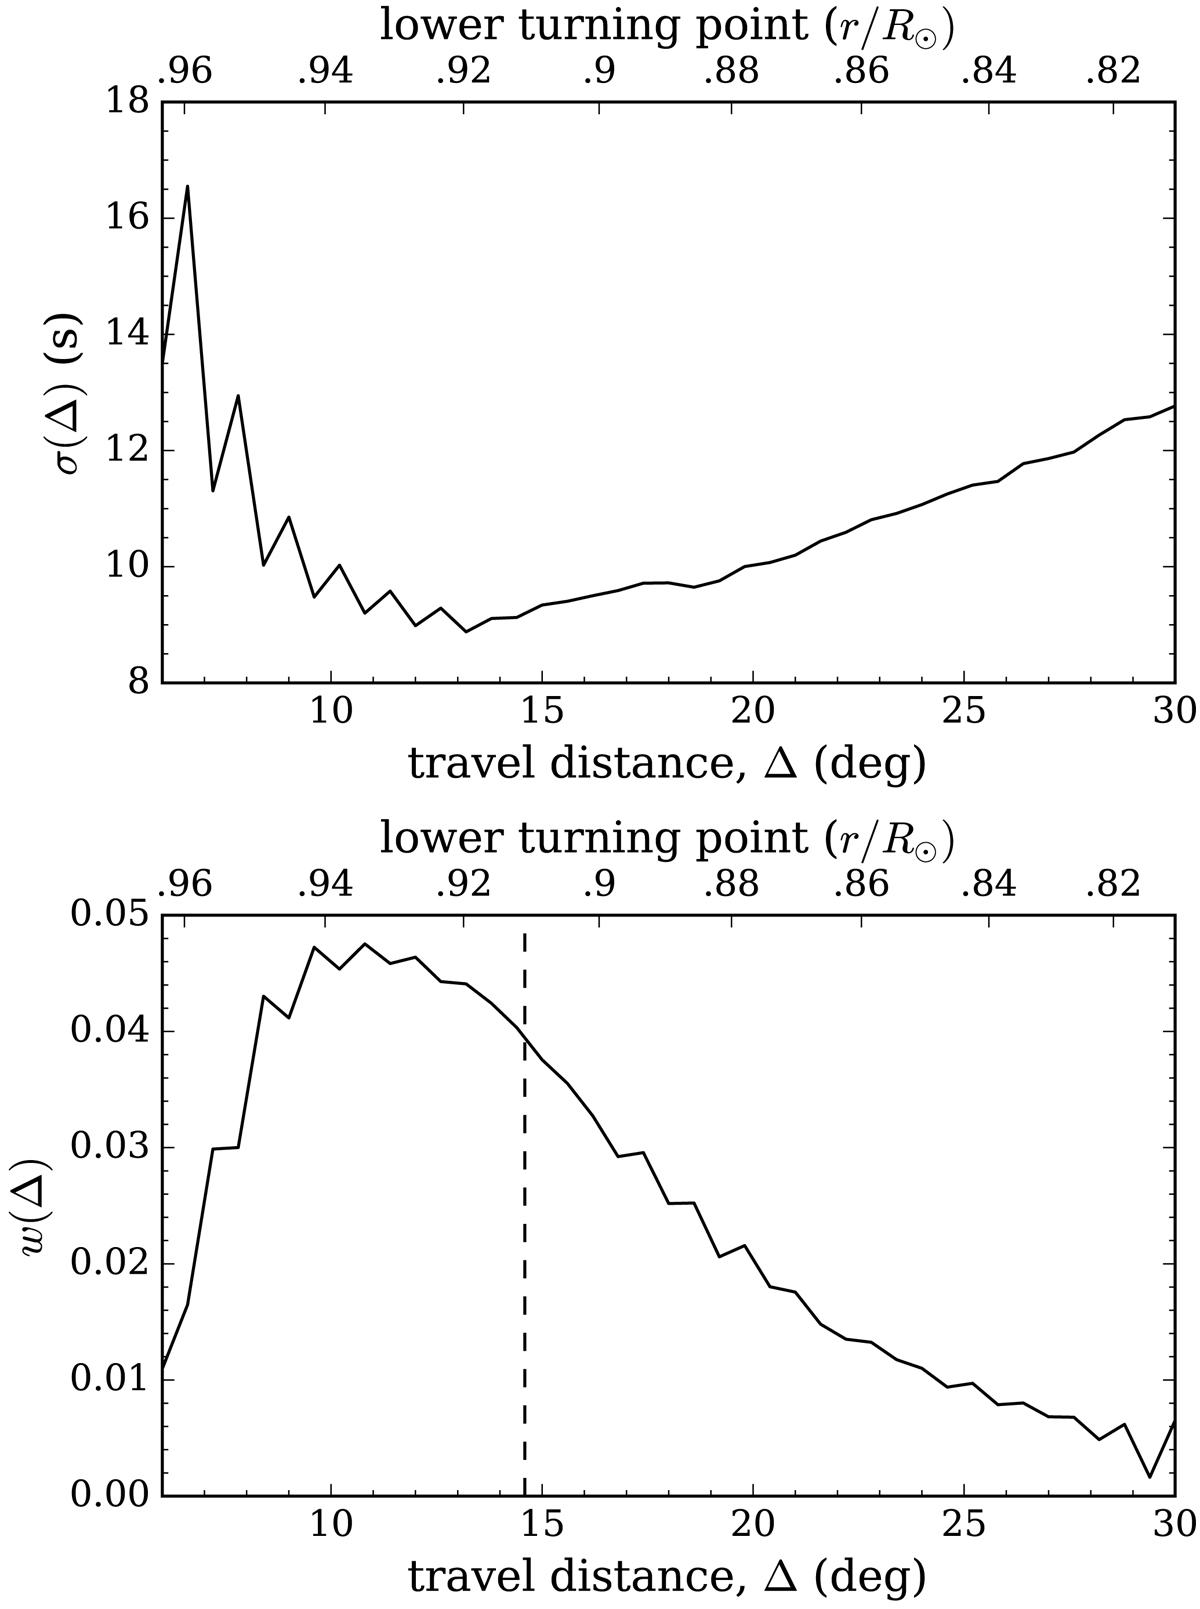
Top: standard deviation of the measured travel-time shifts (square root of the diagonal elements of Λ) as a function of distance. The zigzag might be due to the discreteness of the windows that isolate the single-skip wavelet in the cross-covariance function when fitting the travel-time shifts, particularly for short-distance cases in which the slope of the single-skip ridge in the time-distance diagram is steepest. Bottom: weighting function, w(Δ), as a function of distance. The corresponding radii of the lower turning points from the ray approximation are indicated at the top. The weighted mean distance (vertical dashed line) is about 14.6°, which corresponds to a lower turning point of ∼0.91 R⊙.
Current usage metrics show cumulative count of Article Views (full-text article views including HTML views, PDF and ePub downloads, according to the available data) and Abstracts Views on Vision4Press platform.
Data correspond to usage on the plateform after 2015. The current usage metrics is available 48-96 hours after online publication and is updated daily on week days.
Initial download of the metrics may take a while.