Fig. 1.
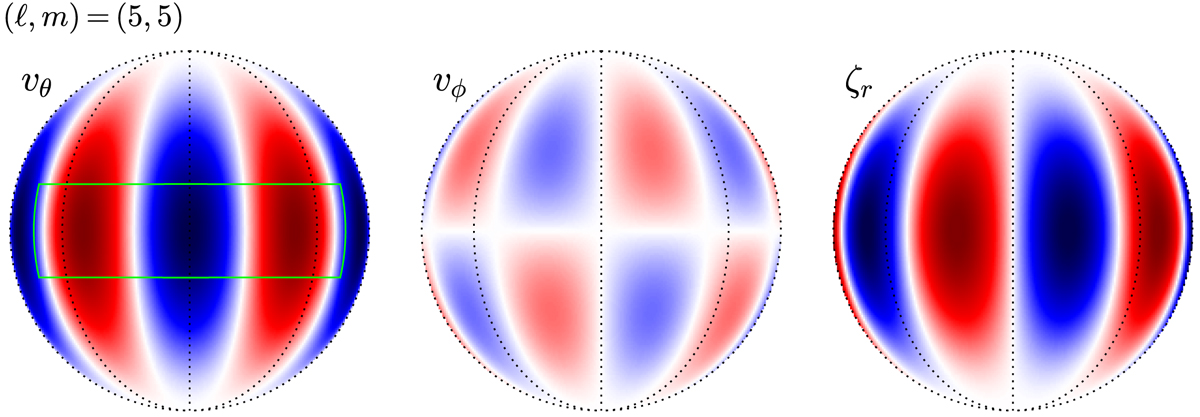
Classical sectoral r mode with m = 5, seen from the equatorial plane of a uniformly rotating solar model. The three panels show the southward flow vθ, the prograde flow vϕ, and the radial vorticity ζr (from left to right) in the corotating frame. The color scale is the same for vθ and vϕ with red positive and blue negative while the colors for the ζr indicate radially outward (red) or inward (blue) directions. The black dotted lines represent constant longitudes fixed in the corotating frame. The green rectangle marks the equatorial area (±15°) in which we measure vθ in this paper. A movie showing the patterns propagating in the retrograde direction in the corotating frame is available online.
Current usage metrics show cumulative count of Article Views (full-text article views including HTML views, PDF and ePub downloads, according to the available data) and Abstracts Views on Vision4Press platform.
Data correspond to usage on the plateform after 2015. The current usage metrics is available 48-96 hours after online publication and is updated daily on week days.
Initial download of the metrics may take a while.