Fig. 5.
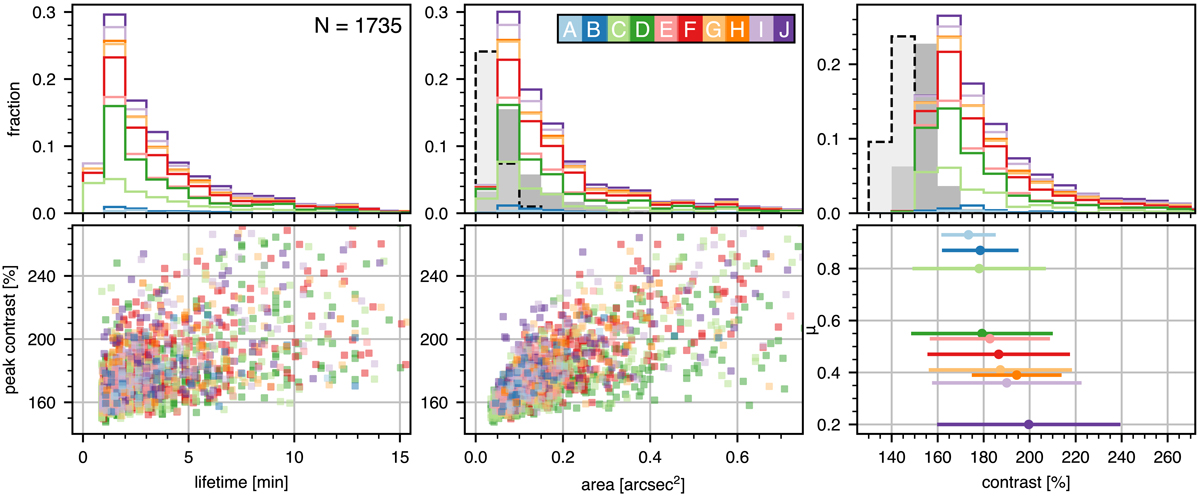
Statistics of all 1735 Ellerman bomb detections in Hα. In all panels the ten different data sets are colour-coded blue-green-red-orange-purple along increasing viewing angle (decreasing μ); see also the top middle panel for the colour-correspondence of each data set A–J. Upper row: stacked occurrence histograms as function of lifetime, maximum area, and contrast. The histogram bin sizes are 1 min, 0.05 arcsec2, and 10%. Since the coloured histograms are stacked the topmost dark purple ones also outline the cumulative distributions. The dark grey and dash-outlined, light grey overlays in the second and third panels show the cumulative distributions for the mean and minimum area and contrast over the lifetime of each detection, respectively. These grey overlay histograms have been scaled down by a factor 3 in height to fit on the same scale as the coloured histograms. Lower row: scatter plots of peak contrast as function of lifetime and maximum area. The last panel shows peak contrasts at the different μ values, with the bar lengths showing the rms peak contrast spreads around their mean values shown by the dots.
Current usage metrics show cumulative count of Article Views (full-text article views including HTML views, PDF and ePub downloads, according to the available data) and Abstracts Views on Vision4Press platform.
Data correspond to usage on the plateform after 2015. The current usage metrics is available 48-96 hours after online publication and is updated daily on week days.
Initial download of the metrics may take a while.