Fig. 3.
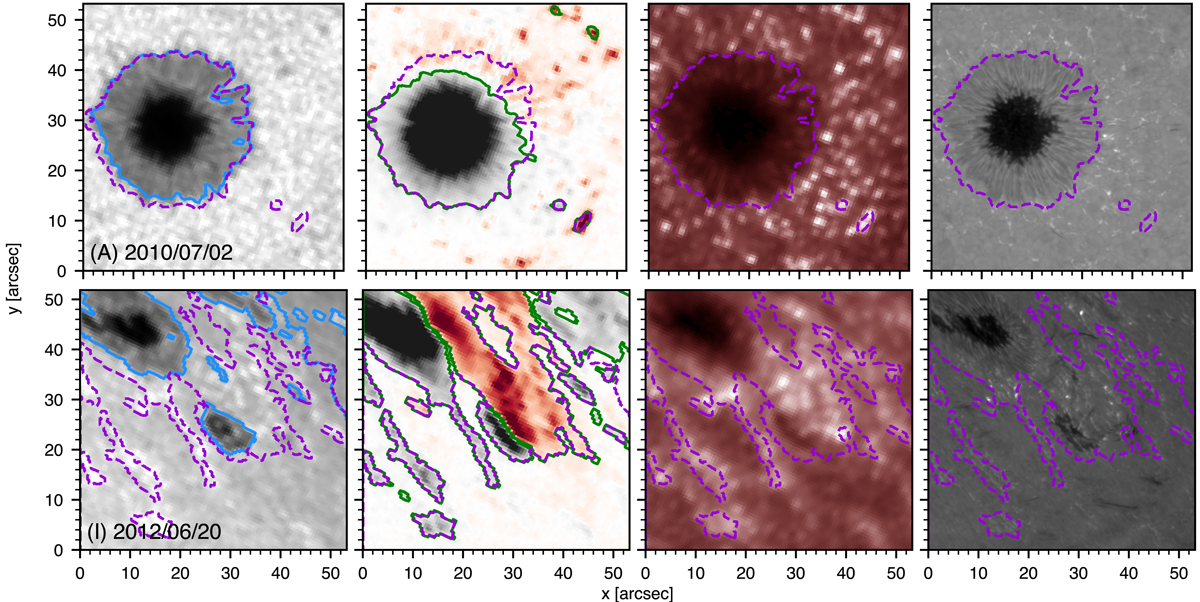
HMI mask construction for data sets A (viewing angle μ = 0.93, top row) and I (μ = 0.36, bottom row). The masks serve to define the local quiet area for reference brightness thresholding. Left to right: HMI continuum image, HMI line-of-sight magnetogram (positive polarity in red, negative in black, zero field strength white), AIA 1700 Å image, blue wing Hα image. The HMI intensity mask is outlined by blue contours in the first column, the HMI magnetic field mask by green contours in the second column. The composite mask is shown in all panels by purple dashed contours. The small green-only islands in the second column are blocked by the minimum-area constraint. In the last panel the blocked part covers most of the upper half including all Ellerman bombs.
Current usage metrics show cumulative count of Article Views (full-text article views including HTML views, PDF and ePub downloads, according to the available data) and Abstracts Views on Vision4Press platform.
Data correspond to usage on the plateform after 2015. The current usage metrics is available 48-96 hours after online publication and is updated daily on week days.
Initial download of the metrics may take a while.