Fig. 2.
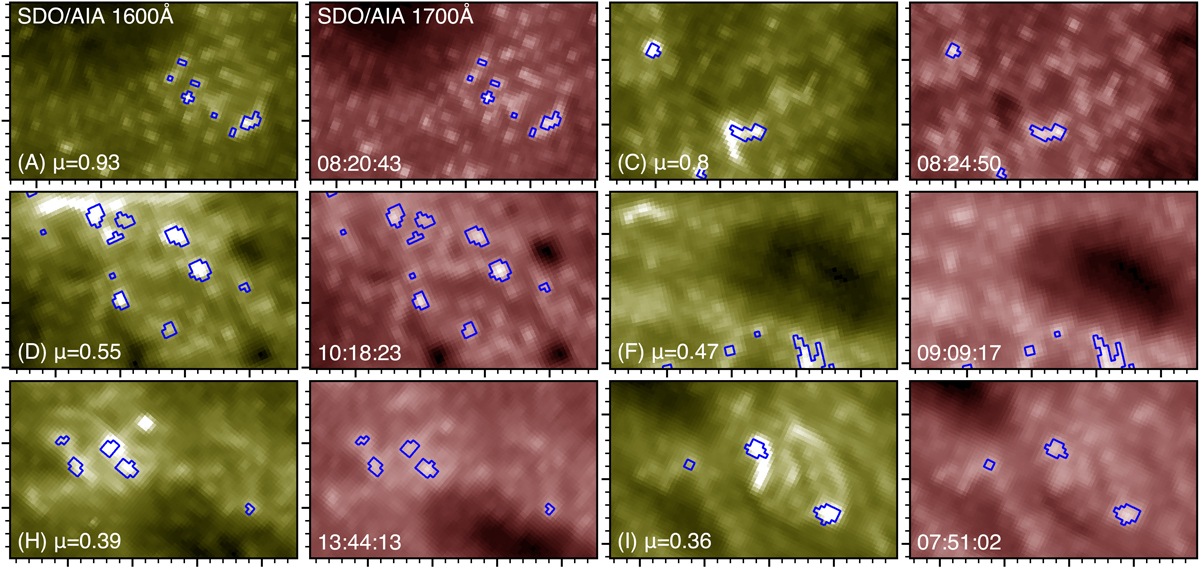
Feature visibilities in AIA 1600 Å (first and third columns) and 1700 Å (second and fourth columns). The panel pairs show selected cutouts for data sets A, C, D, F, H and I, labelled with their μ values in the 1600 Å panels. The cutout locations are outlined by dashed frames in the corresponding panels of Fig. 1. In order to accommodate the dynamic range the square root of the intensity is shown. The byte scaling is common between pairs and is defined so that quiet areas obtain the same apparent average brightness in 1600 and 1700 Å at a scale that saturates at 15σ above this quiet average for 1700 Å except for set F where 10σ was used to for better display contrast. At these values no 1700 Å image is clipped; only the brightest 1600 Å features are. The blue contours outline 1700 Å areas at least 5σ above the quiet average. Major tick marks are spaced 10″ apart, minor tick marks 2″ as in Fig. 1.
Current usage metrics show cumulative count of Article Views (full-text article views including HTML views, PDF and ePub downloads, according to the available data) and Abstracts Views on Vision4Press platform.
Data correspond to usage on the plateform after 2015. The current usage metrics is available 48-96 hours after online publication and is updated daily on week days.
Initial download of the metrics may take a while.