Fig. 9.
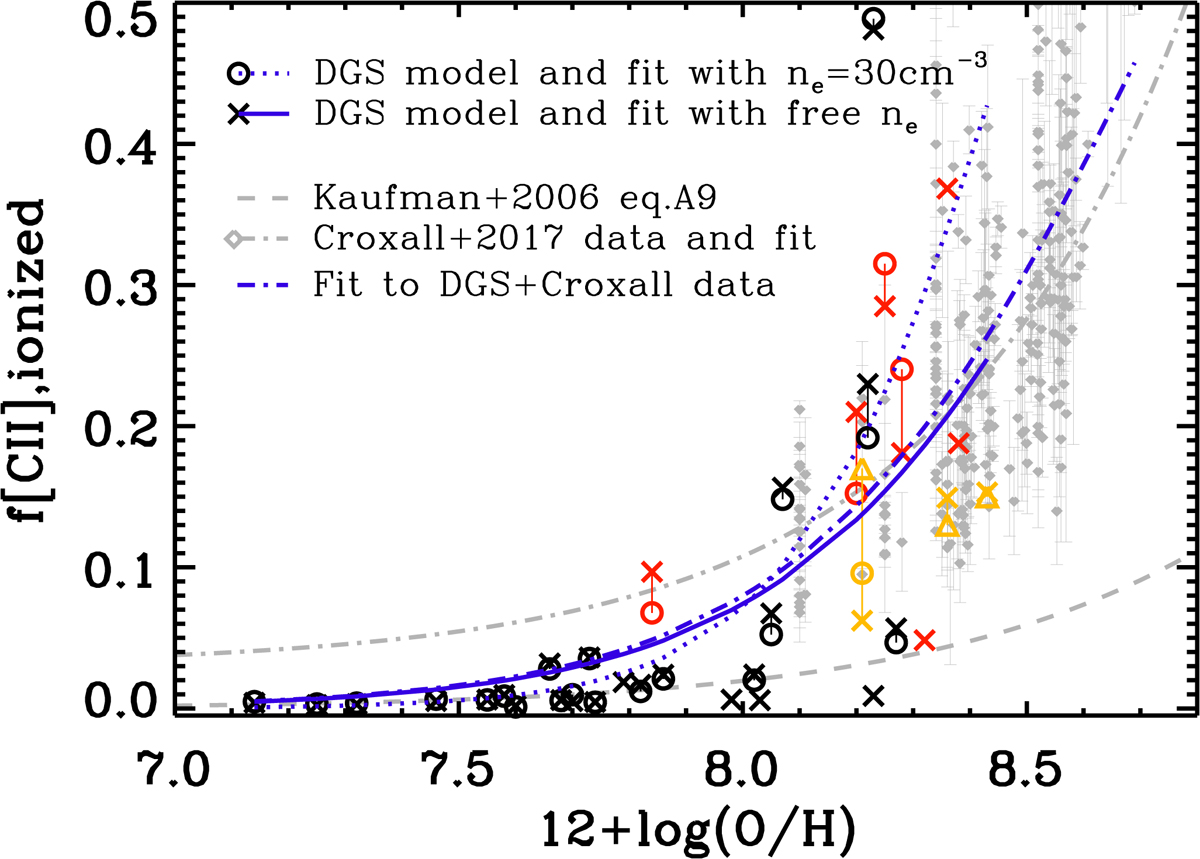
Fraction of [C II] emission coming from the ionized gas phase. We show predictions for each DGS galaxy based on: (1) the best single or mixed models reported in Tables 3 and 4 (crosses), and (2) the best single or mixed models with one model having a fixed low density of 30 cm−3 (circles); predictions yielding ![]() (all models are bad) are not plotted. Red symbols indicate that [N II]122 is detected and orange symbols indicate that both [N II]122 and [N II]205 are detected. For the three galaxies where [N II]205 is detected, we also show the predicted values from simple theoretical calculations, as done in Croxall et al. (2017). We overlaid the data (diamonds) and fit from Croxall et al. (2017) as well as the prediction from PDR models from Kaufman et al. (2006) in gray. Fits to the DGS data and to the DGS (free density) and Croxall et al. (2017) data are shown in blue.
(all models are bad) are not plotted. Red symbols indicate that [N II]122 is detected and orange symbols indicate that both [N II]122 and [N II]205 are detected. For the three galaxies where [N II]205 is detected, we also show the predicted values from simple theoretical calculations, as done in Croxall et al. (2017). We overlaid the data (diamonds) and fit from Croxall et al. (2017) as well as the prediction from PDR models from Kaufman et al. (2006) in gray. Fits to the DGS data and to the DGS (free density) and Croxall et al. (2017) data are shown in blue.
Current usage metrics show cumulative count of Article Views (full-text article views including HTML views, PDF and ePub downloads, according to the available data) and Abstracts Views on Vision4Press platform.
Data correspond to usage on the plateform after 2015. The current usage metrics is available 48-96 hours after online publication and is updated daily on week days.
Initial download of the metrics may take a while.