Fig. 3.
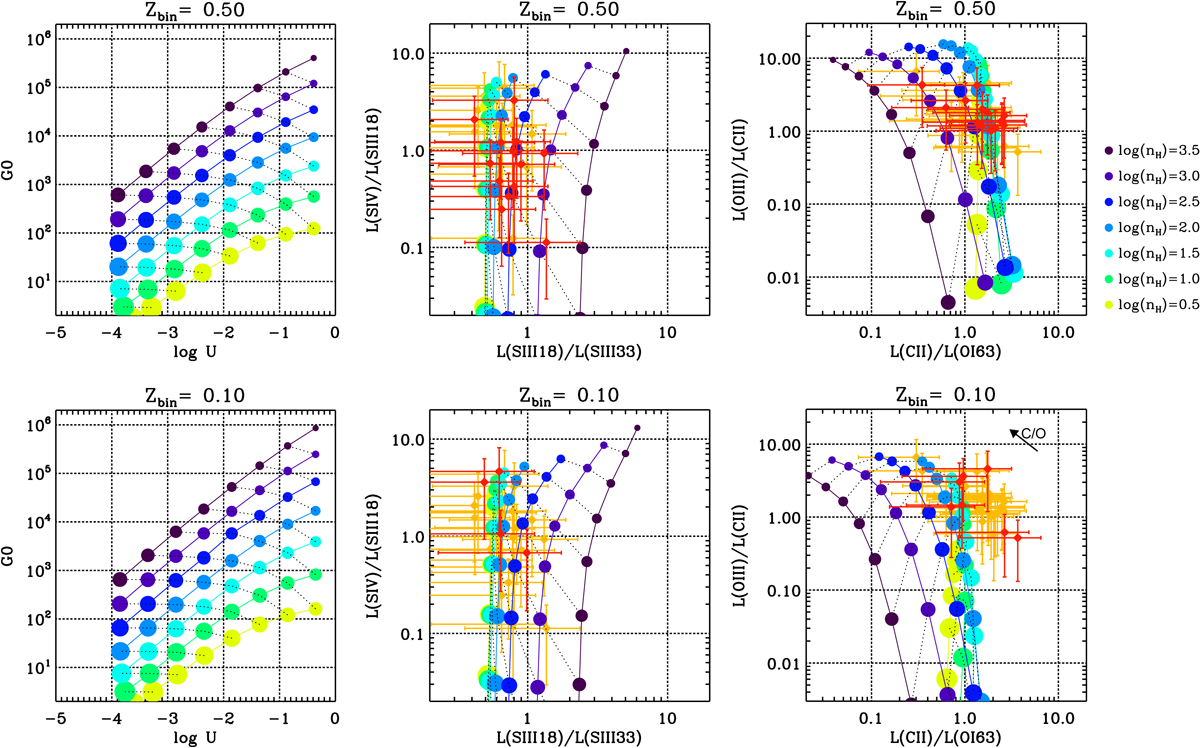
Grid results: predictions of selected line intensities and model parameters, for Zbin = 0.5 (top panels) and Zbin = 0.1 (bottom panels). Color scheme: increasing initial density from 100.5 cm−3 (light green) to 103.5 cm−3 (dark purple). Symbol size: large symbols correspond to small inner radius (large U) and small symbols to large inner radius (small U). Dotted lines connect models with the same inner radius, solid lines connect models with the same density. All observations are overplotted in orange and galaxies in the metallicity bin plotted are highlighted in red. We note that the error bars are large because they include abundance uncertainties (assumed to be 50% of the flux). The PDR covering factor is set to unity. Top right panel: quantitative indication on how the C/O abundance ratio affects the grid predictions from Zbin = 0.5 to Zbin = 0.1. Other effects due to metallicity (e.g., stellar spectra, column density, etc.) are discussed in the text.
Current usage metrics show cumulative count of Article Views (full-text article views including HTML views, PDF and ePub downloads, according to the available data) and Abstracts Views on Vision4Press platform.
Data correspond to usage on the plateform after 2015. The current usage metrics is available 48-96 hours after online publication and is updated daily on week days.
Initial download of the metrics may take a while.