Fig. 7
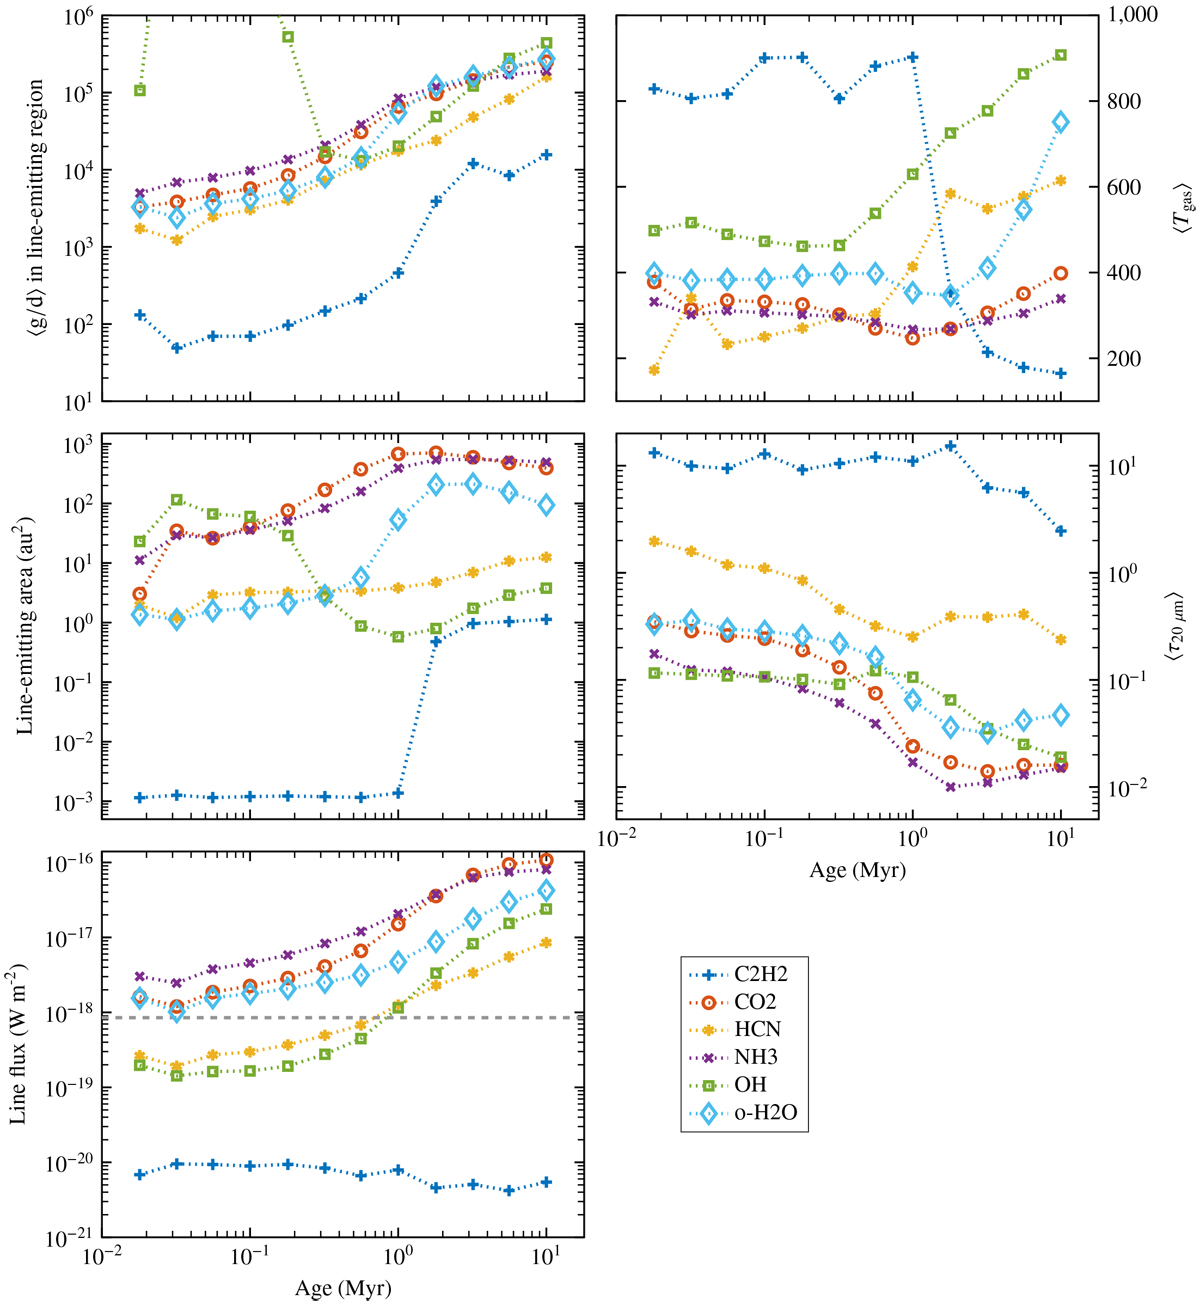
Left, top: gas-to-dust ratio in the line-emitting region of each species, over time. The significant bump seen in the gas-to-dust ratio of OH is misleading. Our measurement of the line-emitting area is biased by the fact that there is a small amount of OH emission coming from warm upper layers at relatively large radii. These upper layers have a disproportionately high gas-to-dust ratio. Left, middle: the line-emitting area, in square astronomical units, of each species overtime. This area is calculated from a face-on perspective, assuming that the line emission comes from an annulus encompassed by the inner and outer radii of the line emission (x15 and x85). Much like the gas-to-dust ratio for less-evolved models, the line-emitting area calculation of OH is biased by small amounts of emission at larger radii. Left, bottom: the escape probability line flux of each species over time. The dashed horizontal line indicates the nominal 1σ Spitzer sensitivity of 8.5 × 10⁻¹⁹ W m−2 achievable with a 512 second integration. Right, top: the density-averaged gas temperature in the line-emitting region of each species over time. Right, middle: the density-averaged vertical optical depth of the dust at 20 μm in the line-emitting region of each species over time.
Current usage metrics show cumulative count of Article Views (full-text article views including HTML views, PDF and ePub downloads, according to the available data) and Abstracts Views on Vision4Press platform.
Data correspond to usage on the plateform after 2015. The current usage metrics is available 48-96 hours after online publication and is updated daily on week days.
Initial download of the metrics may take a while.