Fig. 9.
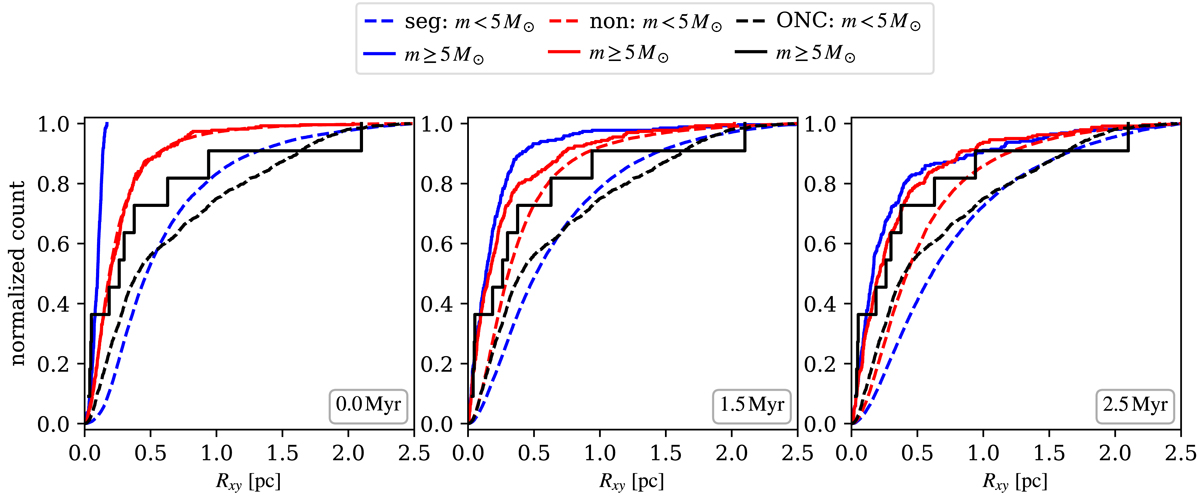
Comparison of the average radial profiles (based on ten realisations of our models with 2.4k stars) of the projected models of segregated (blue) and non-segregated clusters (red) with the real ONC (black). In several time frames, we show two mass groups: m ≥ 5 M⊙ (solid line) and m < 5 M⊙ (dashed line). The corresponding statistic for each group can be found in Fig. 7, with the comparison even beyond the age of the ONC.
Current usage metrics show cumulative count of Article Views (full-text article views including HTML views, PDF and ePub downloads, according to the available data) and Abstracts Views on Vision4Press platform.
Data correspond to usage on the plateform after 2015. The current usage metrics is available 48-96 hours after online publication and is updated daily on week days.
Initial download of the metrics may take a while.