Fig. 6.
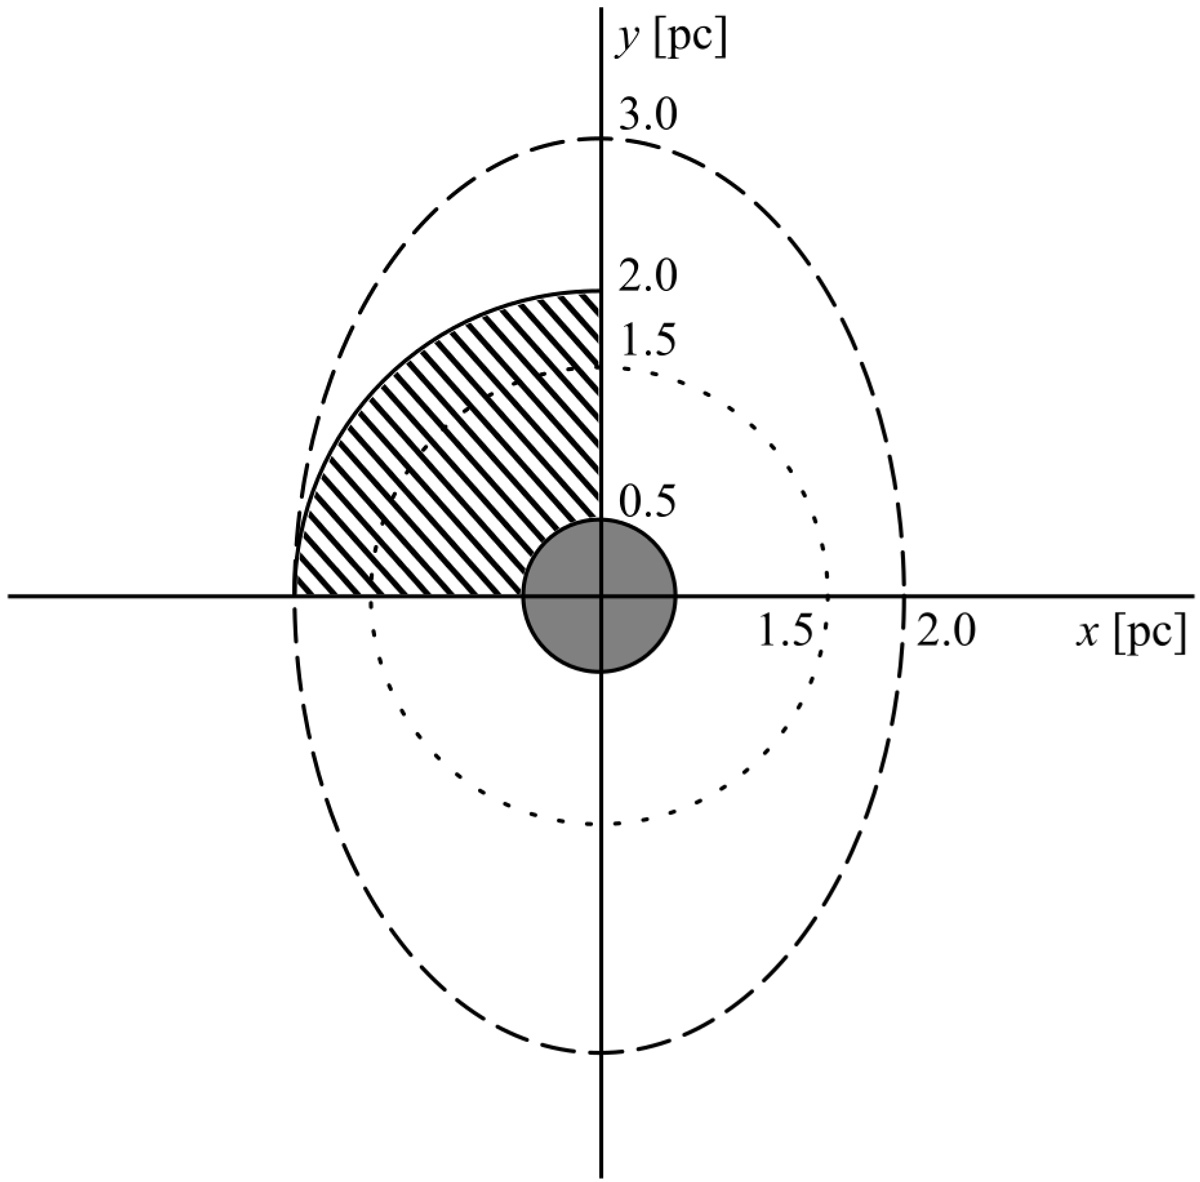
Schematic plot of the modifications made to the models in order to compare them to the ONC. The hatched area has artificial extinction of low-mass stars (i.e. stars with m < 5 M⊙ are removed), the dashed ellipse demonstrates the scaling of low-mass stars along the y-axis by a factor of 1.5, the dotted circle illustrates the isotropic scaling of all high-mass stars, and the grey circle covers the central region where low-mass stars are left without scaling.
Current usage metrics show cumulative count of Article Views (full-text article views including HTML views, PDF and ePub downloads, according to the available data) and Abstracts Views on Vision4Press platform.
Data correspond to usage on the plateform after 2015. The current usage metrics is available 48-96 hours after online publication and is updated daily on week days.
Initial download of the metrics may take a while.