Fig. 3.
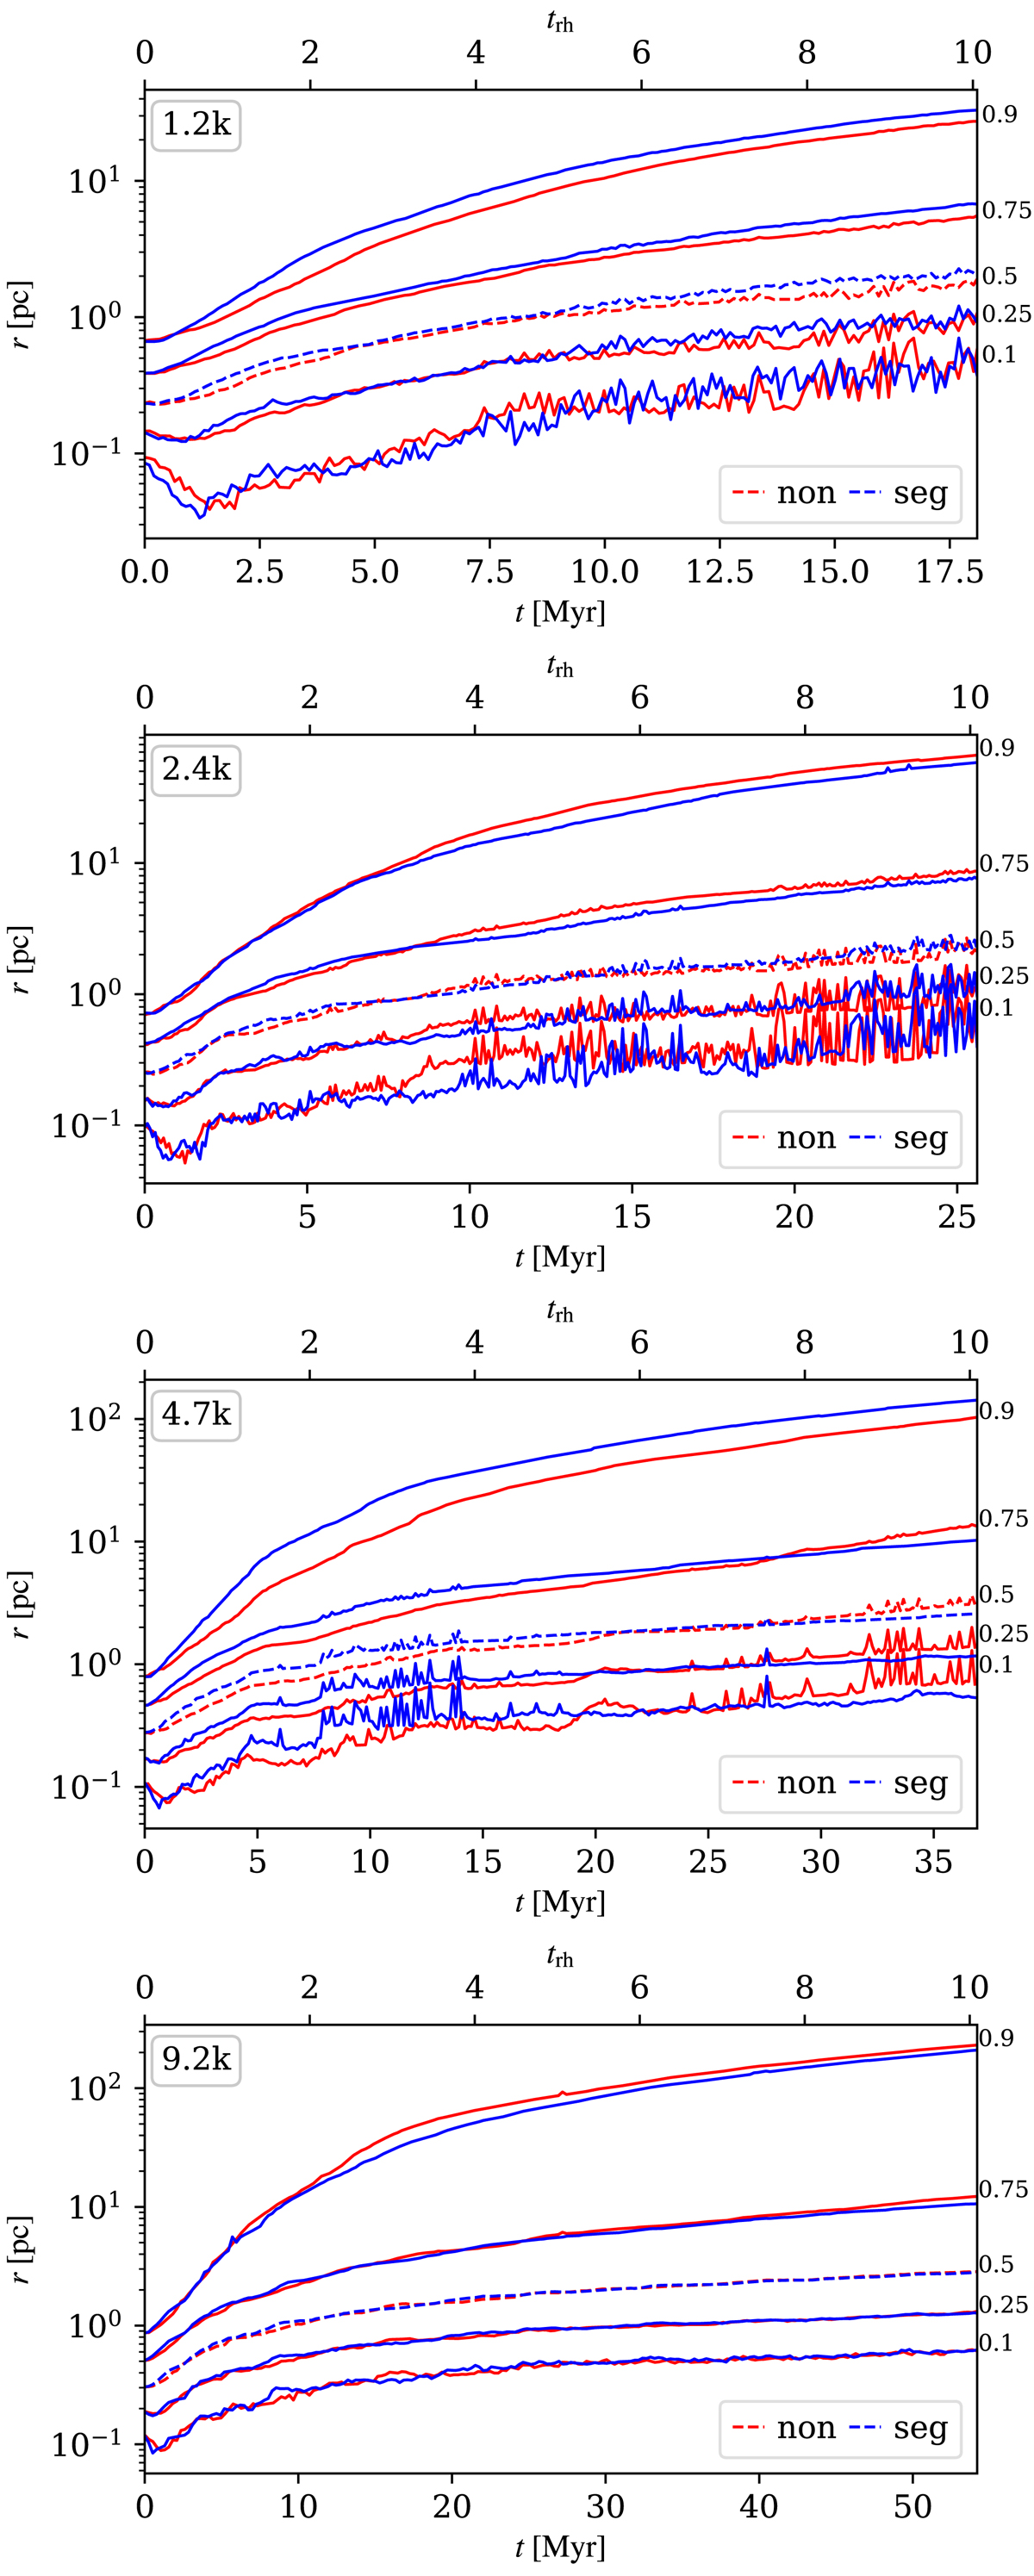
Lagrangian radii of both segregated (blue) and non-segregated (red) models with 1.2k, 2.4k, 4.7k, and 9.2k stars (panels from top to bottom), averaged over all realisations of each model. The time axis reaches ≈10 trh, the corresponding mass fractions (10, 25, 50, 75, and 90 % from bottom to top) are on the right-hand side of each panel, and the half-mass radius is plotted with a dashed line.
Current usage metrics show cumulative count of Article Views (full-text article views including HTML views, PDF and ePub downloads, according to the available data) and Abstracts Views on Vision4Press platform.
Data correspond to usage on the plateform after 2015. The current usage metrics is available 48-96 hours after online publication and is updated daily on week days.
Initial download of the metrics may take a while.