Fig. 2.
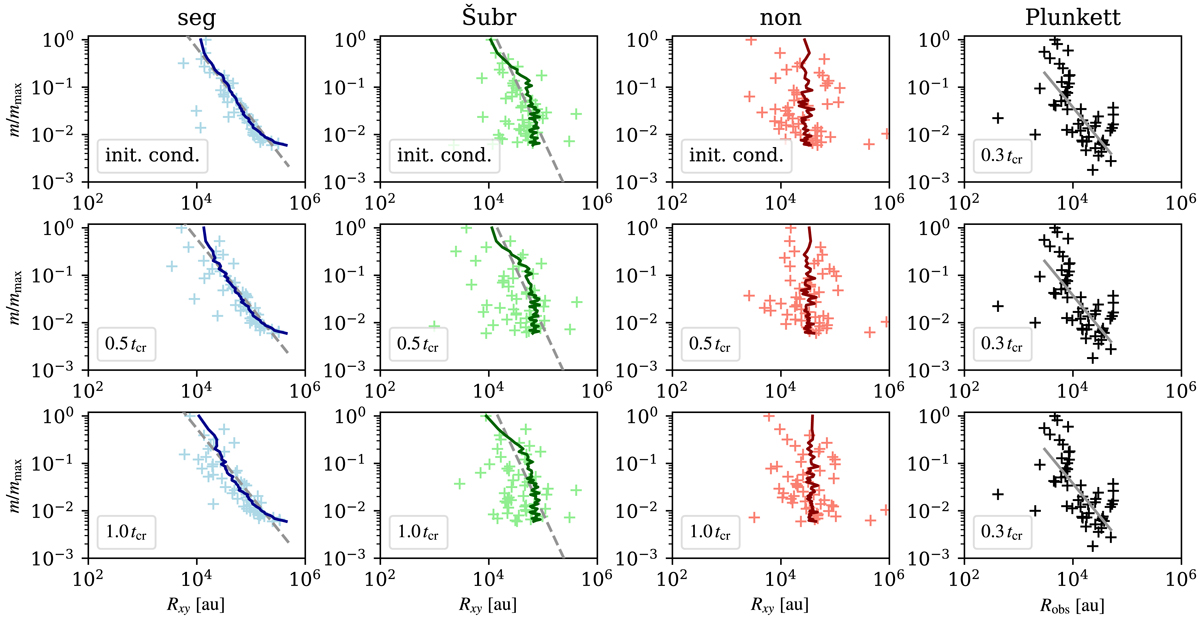
Three left upper panels: initial conditions of our models containing 52 stars: seg and Šubr are initially mass segregated with S = 1 and S = 0.5, respectively, and non is without any initial mass segregation (S = 0), see Sect. 2. Lower panels: models in a slightly evolved stage (at 0.5 tcr and 1.0 tcr). The solid line in each plot represents the average position for a star of a given mass in 100 realisations, whereas the lighter crosses are the positions from one random realisation. The power-law fit of both seg and Šubr models is shown by the grey dashed line. For comparison, right panels: observed data and the fitted slope (cf. Plunkett et al. 2018); the same dataset is used in all rows. We note that the horizontal axis of each plot is in projection to the xy plane.
Current usage metrics show cumulative count of Article Views (full-text article views including HTML views, PDF and ePub downloads, according to the available data) and Abstracts Views on Vision4Press platform.
Data correspond to usage on the plateform after 2015. The current usage metrics is available 48-96 hours after online publication and is updated daily on week days.
Initial download of the metrics may take a while.