Free Access
Fig. B.2.
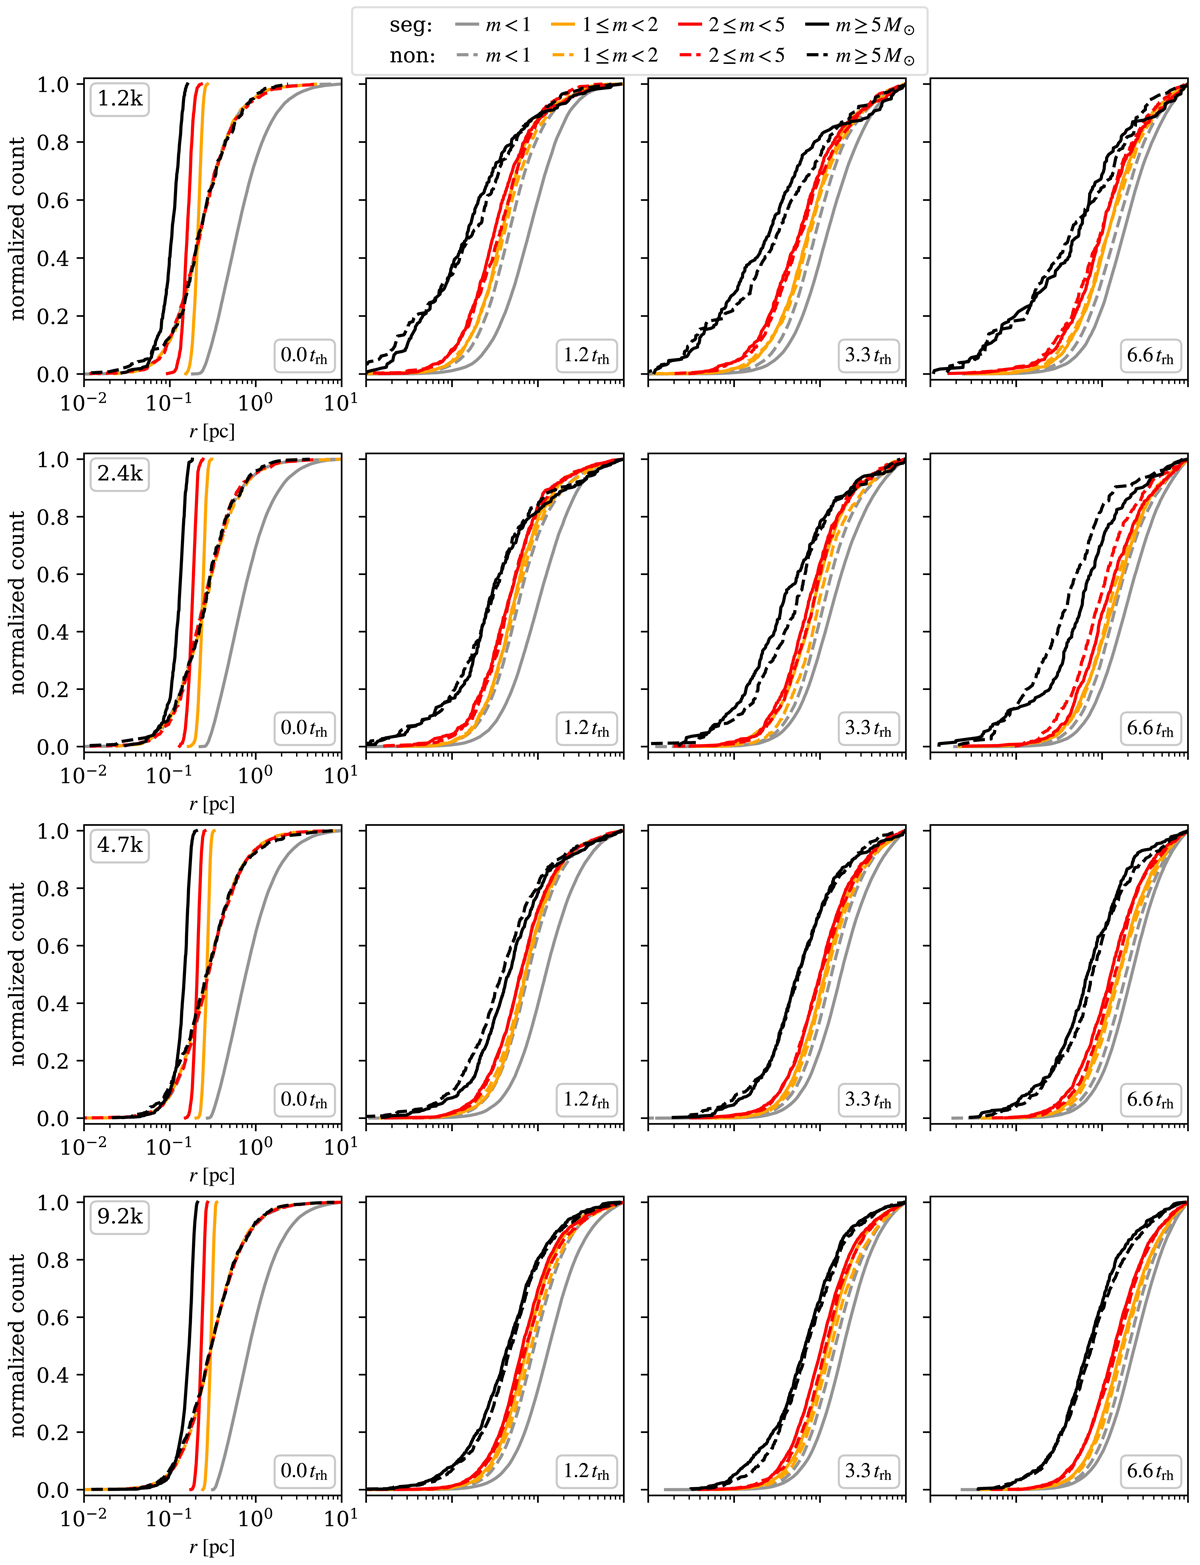
Cumulative distribution functions of stars in four different mass ranges in several key time frames (the initial conditions, t ≈ 0.5 τv, t ≈ τv and t ≈ 2 τv, given in the units of the median relaxation time, see also Fig. 5). Models with 1.2k, 2.4k, 4.7k, and 9.2k stars are plotted (from top to bottom).
Current usage metrics show cumulative count of Article Views (full-text article views including HTML views, PDF and ePub downloads, according to the available data) and Abstracts Views on Vision4Press platform.
Data correspond to usage on the plateform after 2015. The current usage metrics is available 48-96 hours after online publication and is updated daily on week days.
Initial download of the metrics may take a while.