Fig. B.1.
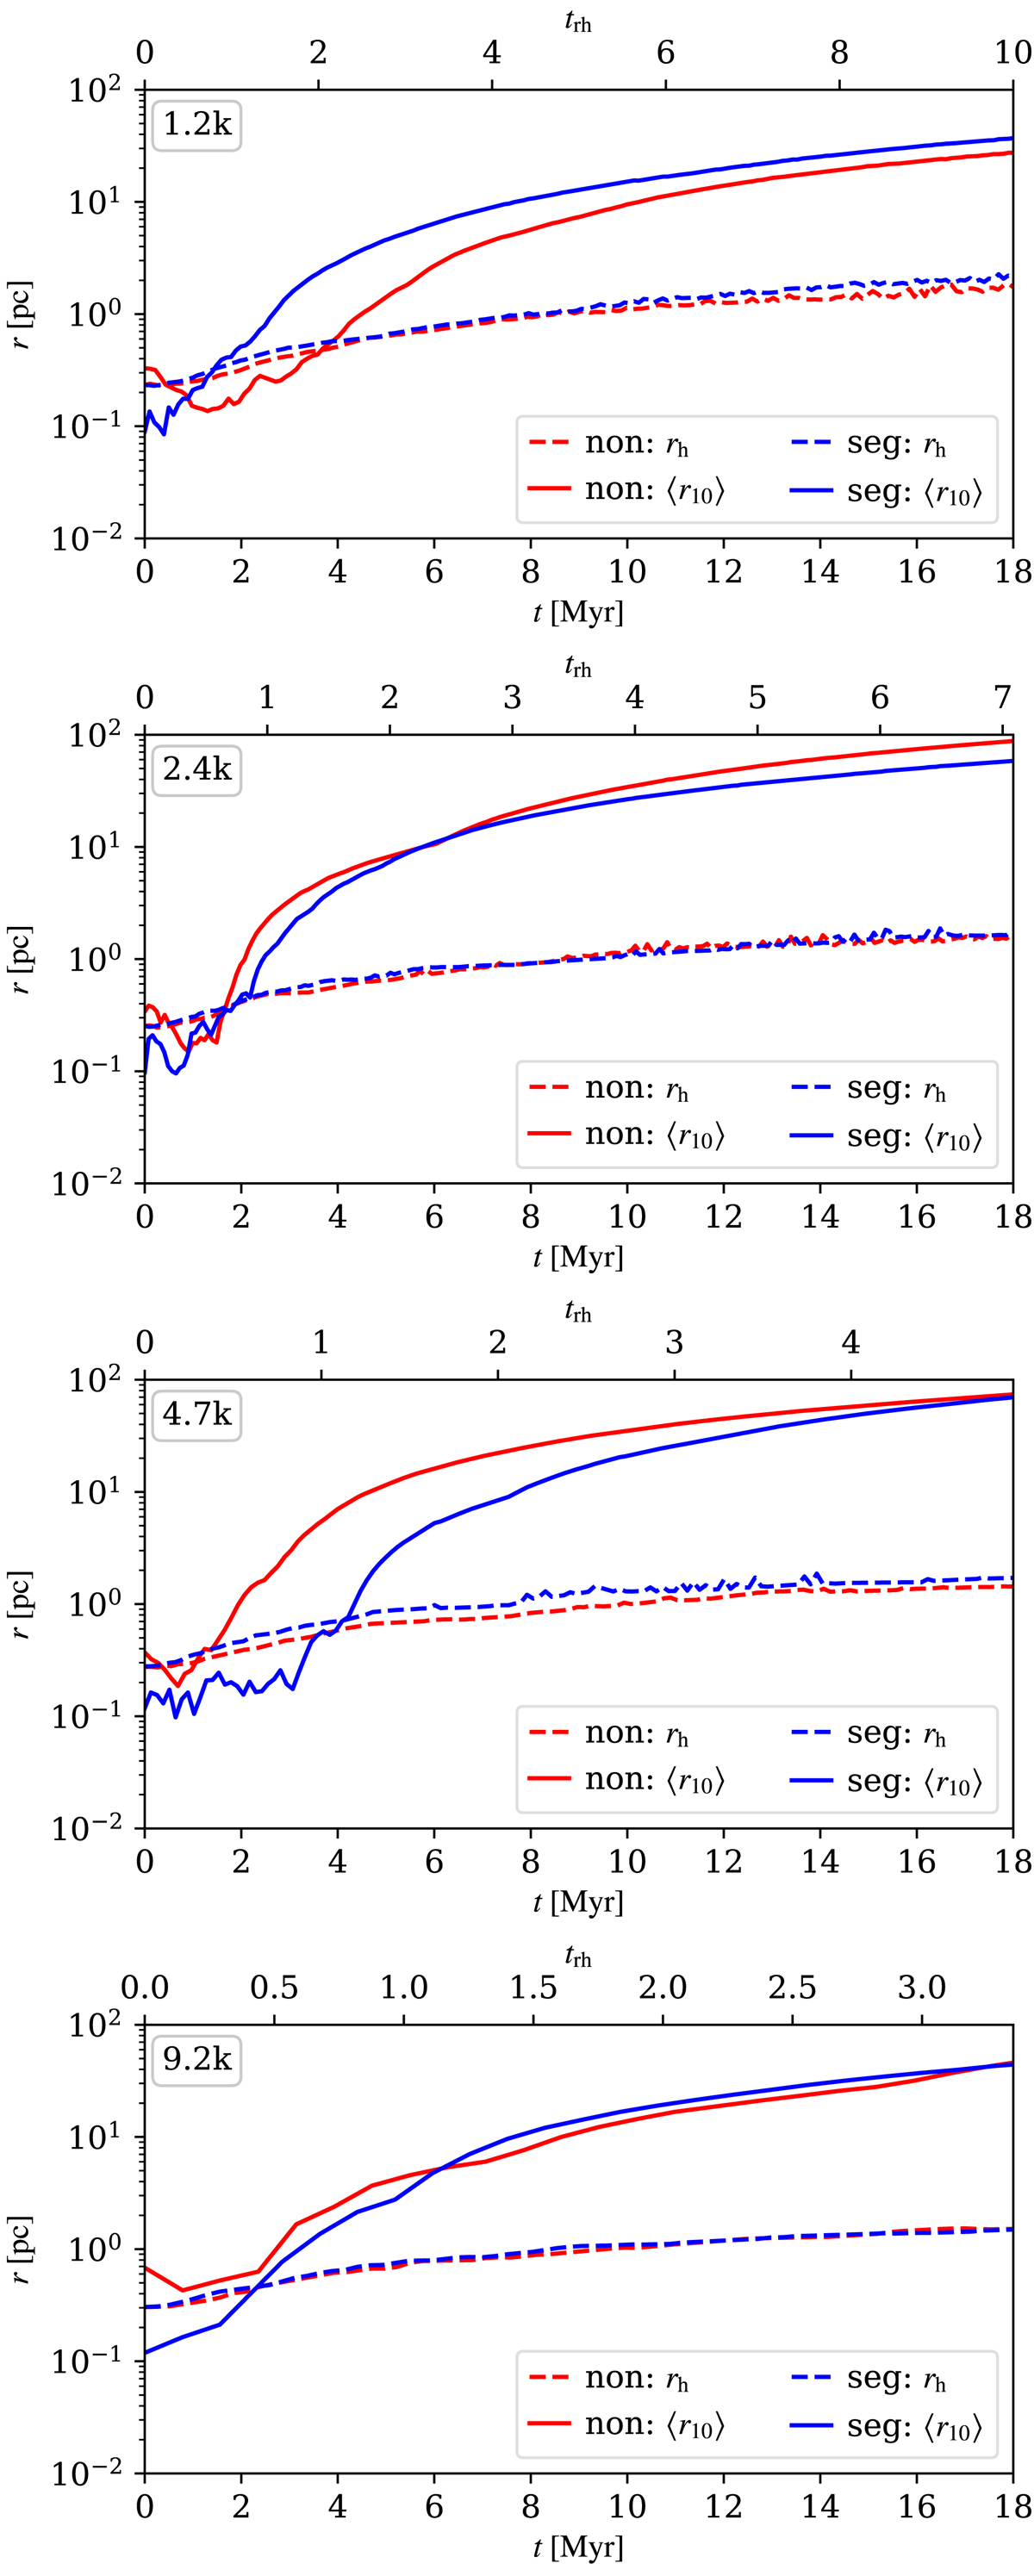
Average positions of the most massive stars that are in the top 10 % of the total mass of the cluster (solid lines). Models with 1.2k, 2.4k, 4.7k, and 9.2k stars are plotted from top to bottom. The data are averaged over all realisations of a given model. For reference, we also plot the half-mass radius with a dashed line. Time extends to ≈18 Myr.
Current usage metrics show cumulative count of Article Views (full-text article views including HTML views, PDF and ePub downloads, according to the available data) and Abstracts Views on Vision4Press platform.
Data correspond to usage on the plateform after 2015. The current usage metrics is available 48-96 hours after online publication and is updated daily on week days.
Initial download of the metrics may take a while.