Fig. A.1.
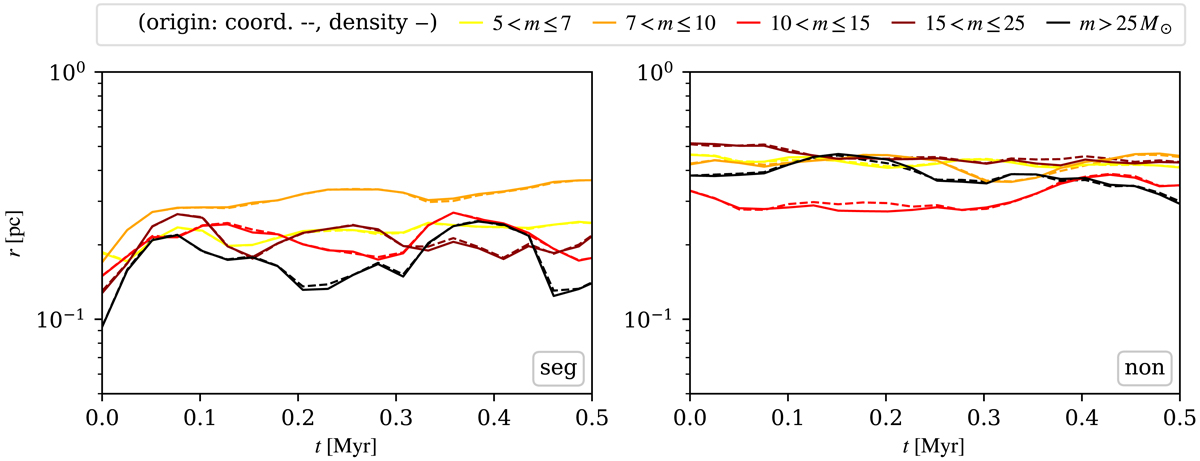
Evolution of the radii of high-mass stars in time (up to 0.5 Myr, i.e. approximately 3.5 tcr) of the 9.2k model (one realisation each of seg and non is plotted). Colours represent stars in different mass bins (from 5 M⊙ < m ≤ 7 M⊙ up to m > 25 M⊙). The bins contain 39, 26, 18, 13, and 11 stars, respectively. The mean position within each bin is given. Radii with respect to the coordinate origin (dashed lines) and the density centre (solid lines) are plotted.
Current usage metrics show cumulative count of Article Views (full-text article views including HTML views, PDF and ePub downloads, according to the available data) and Abstracts Views on Vision4Press platform.
Data correspond to usage on the plateform after 2015. The current usage metrics is available 48-96 hours after online publication and is updated daily on week days.
Initial download of the metrics may take a while.