Fig. 8.
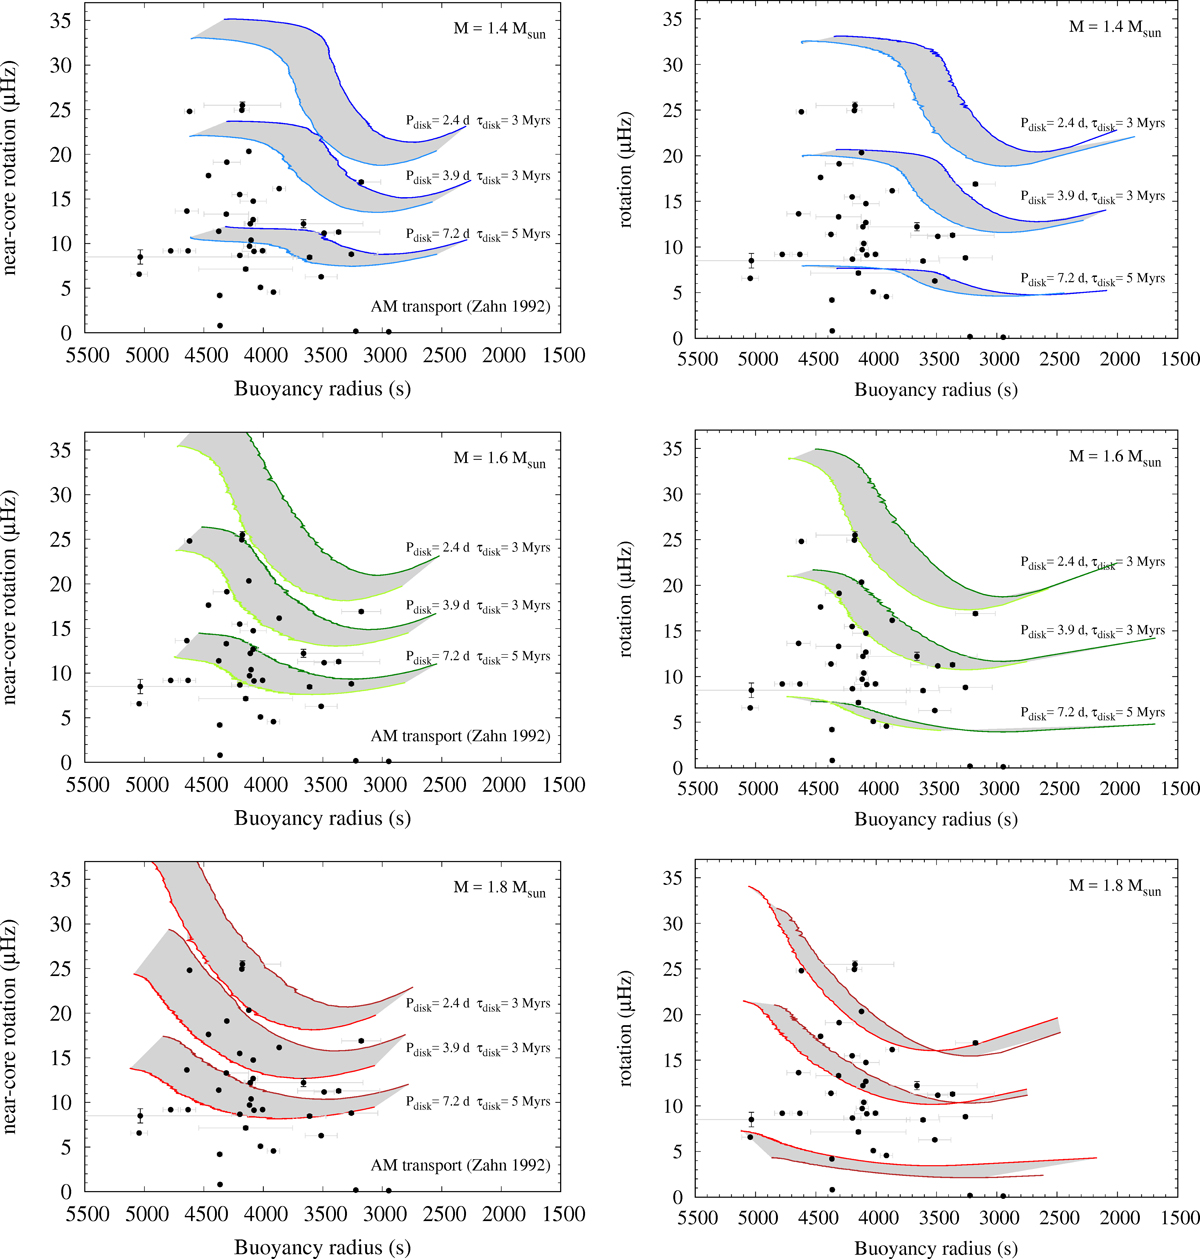
Rotational evolution as a function of the buoyancy radius. We illustrate the observations in black filled circles. The grey areas represent the rotation rates versus buoyancy radius covered when the metallicity varies from ![]() to
to ![]() , where the mean and the standard deviation of the observed sample are considered. The coloured solid lines are the evolutionary models for three typical masses of γ Dor stars: 1.4 M⊙ in blue (top), 1.6 M⊙ in green (middle) and 1.8 M⊙ in red (bottom). In each panel, the three sets of models relate to the different initial conditions set up in Sect. 3: from top to bottom: disc locking at a period of 2.4 days during 3 Myrs, 3.9 days during 3 Myrs, and 7.2 days during 5 Myrs. Left: evolution of the angular momentum distribution has been calculated with transport by meridional circulation and shears (Z92). Right: solid-body rotation is enforced all along evolution. The x-axis has been inverted so that the behaviour with evolution goes from left to right.
, where the mean and the standard deviation of the observed sample are considered. The coloured solid lines are the evolutionary models for three typical masses of γ Dor stars: 1.4 M⊙ in blue (top), 1.6 M⊙ in green (middle) and 1.8 M⊙ in red (bottom). In each panel, the three sets of models relate to the different initial conditions set up in Sect. 3: from top to bottom: disc locking at a period of 2.4 days during 3 Myrs, 3.9 days during 3 Myrs, and 7.2 days during 5 Myrs. Left: evolution of the angular momentum distribution has been calculated with transport by meridional circulation and shears (Z92). Right: solid-body rotation is enforced all along evolution. The x-axis has been inverted so that the behaviour with evolution goes from left to right.
Current usage metrics show cumulative count of Article Views (full-text article views including HTML views, PDF and ePub downloads, according to the available data) and Abstracts Views on Vision4Press platform.
Data correspond to usage on the plateform after 2015. The current usage metrics is available 48-96 hours after online publication and is updated daily on week days.
Initial download of the metrics may take a while.