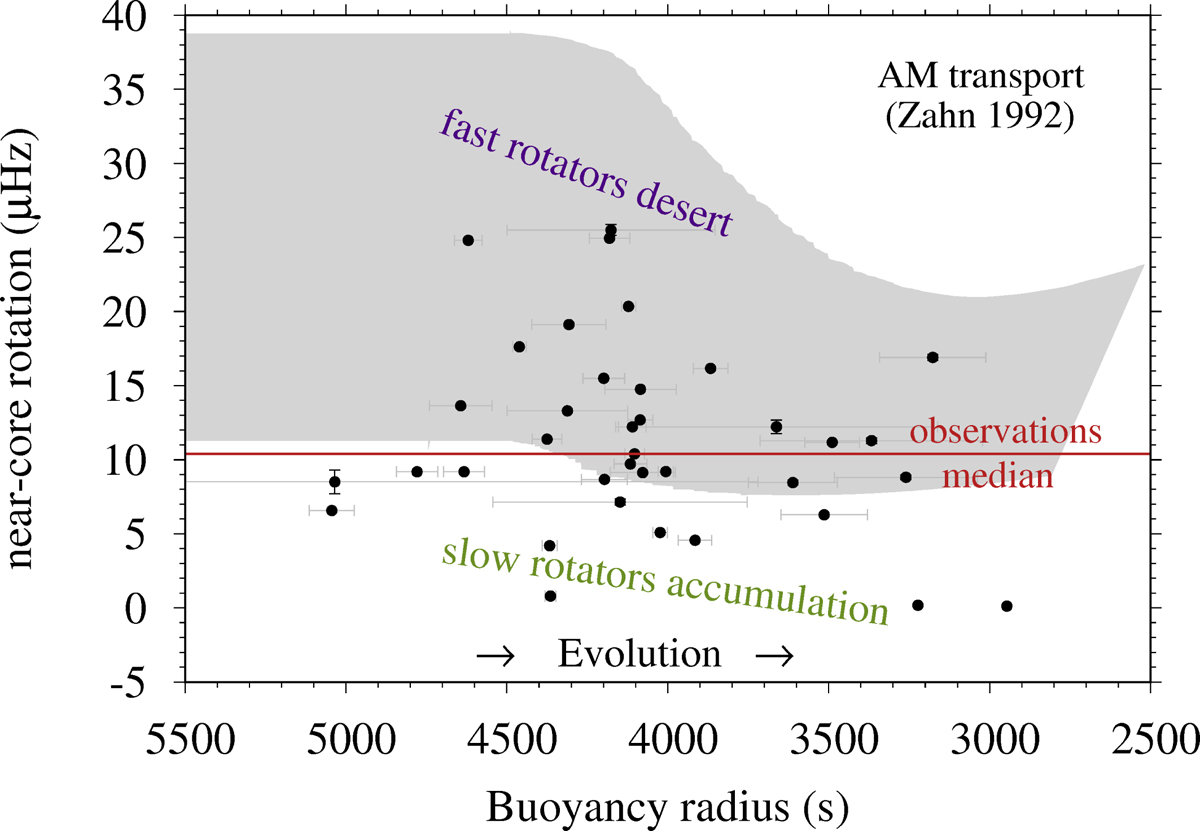
Fig. 6.

Measured near-core rotation rates as a function of the buoyancy radius (black circles), error bars are taken from Van Reeth et al. (2016). The grey area represents the interval of possible rotation rates given the initial conditions set in Sect. 3, and for the transport of angular momentum as formalized by Z92. The red solid line gives the median of the rotation distribution in the main sequence observed sample.
Current usage metrics show cumulative count of Article Views (full-text article views including HTML views, PDF and ePub downloads, according to the available data) and Abstracts Views on Vision4Press platform.
Data correspond to usage on the plateform after 2015. The current usage metrics is available 48-96 hours after online publication and is updated daily on week days.
Initial download of the metrics may take a while.


