Fig. 3.
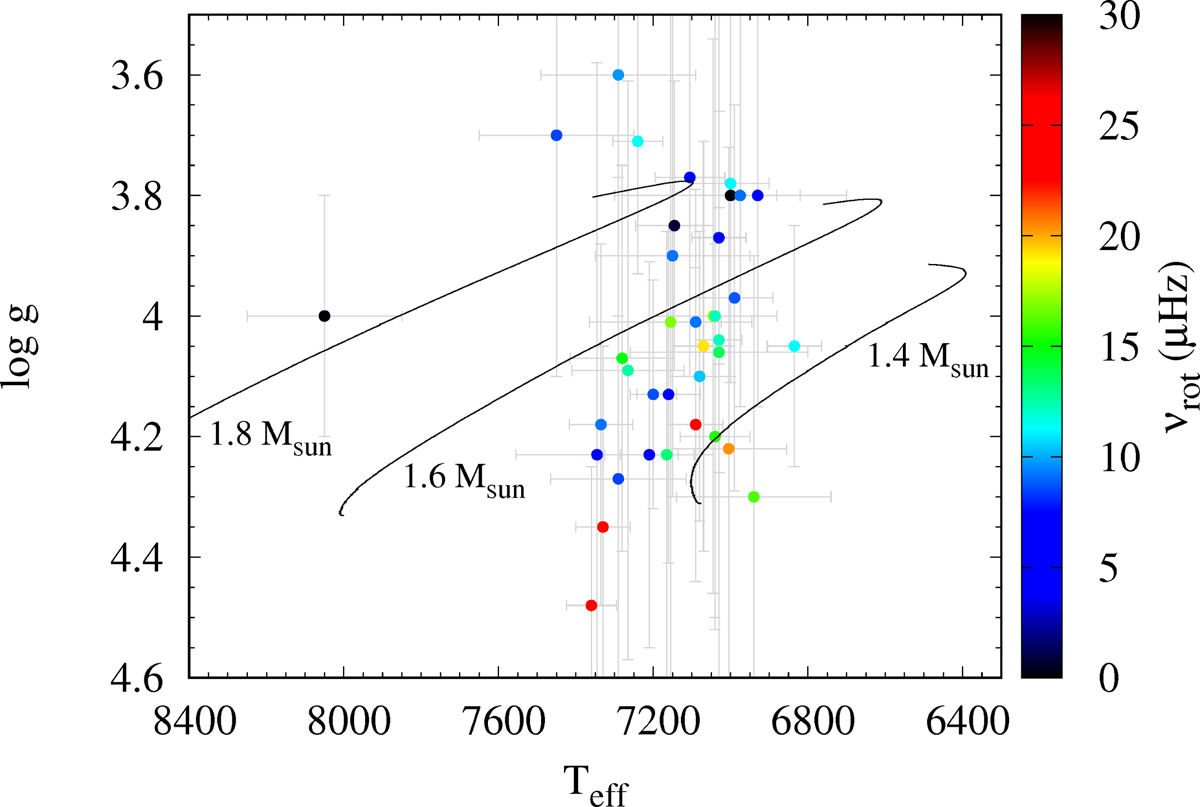
Kiel diagram with the observed stars sample (coloured circles). The atmospheric data use to build this diagram were taken from Van Reeth et al. (2016) and the KASOC catalogue. The colour codes for their measured near-core rotation. To guide the eye, stellar models of 3 typical masses of γ Dor stars have been plotted in black solid lines.
Current usage metrics show cumulative count of Article Views (full-text article views including HTML views, PDF and ePub downloads, according to the available data) and Abstracts Views on Vision4Press platform.
Data correspond to usage on the plateform after 2015. The current usage metrics is available 48-96 hours after online publication and is updated daily on week days.
Initial download of the metrics may take a while.