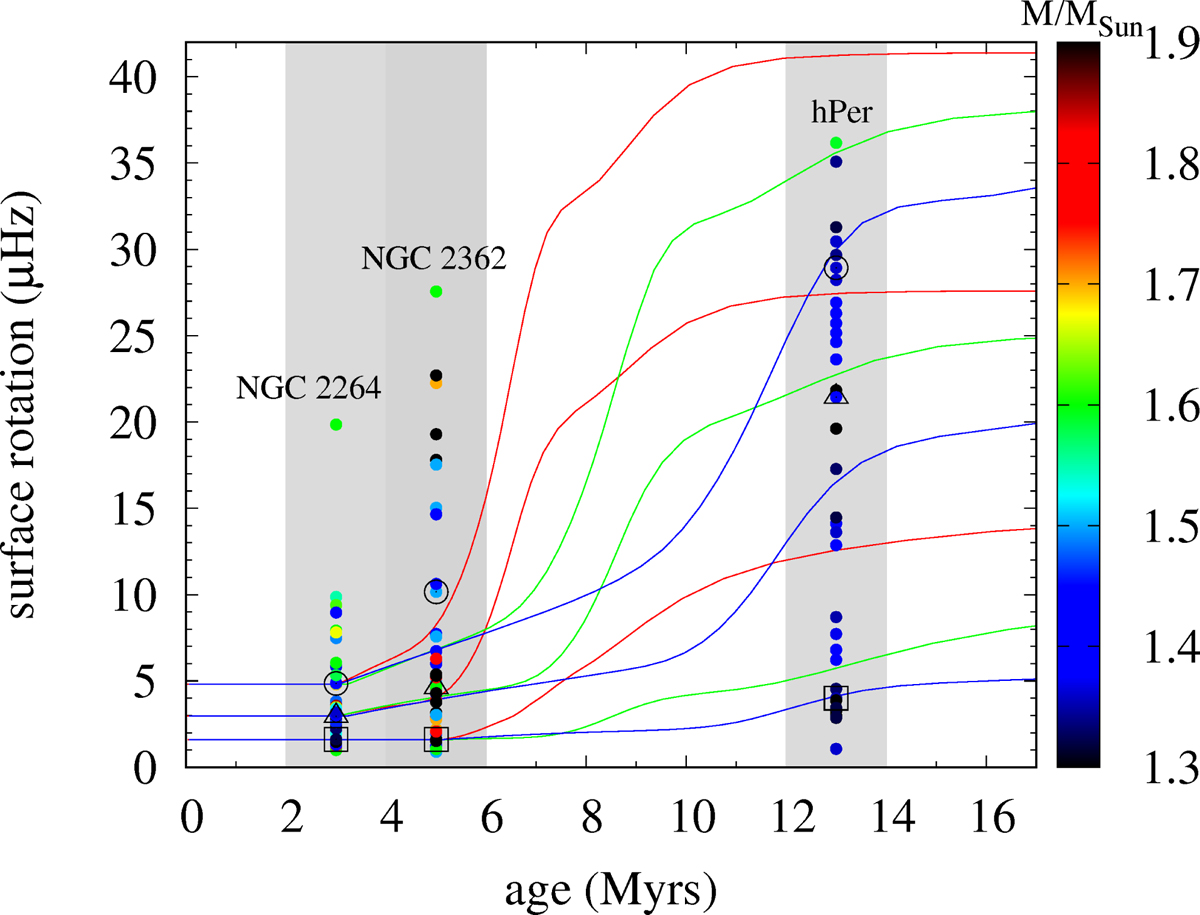
Fig. 1.

Surface rotation distributions in the three selected clusters NGC 2264, NGC 2362 and hPer, as a function of age. The colour codes for the stellar mass (from 1.3 to 1.9 M⊙). The solid lines are given by evolutionary models of 1.4 (in blue), 1.6 (in green) and 1.8 M⊙ (in red). The grey coloured areas symbolize the uncertainty on the age of the clusters which is of around 1 Myr. The squares, the triangles and the open circles represent the 20th percentiles, the median, and the 80th percentile of the rotation distributions in each cluster, respectively.
Current usage metrics show cumulative count of Article Views (full-text article views including HTML views, PDF and ePub downloads, according to the available data) and Abstracts Views on Vision4Press platform.
Data correspond to usage on the plateform after 2015. The current usage metrics is available 48-96 hours after online publication and is updated daily on week days.
Initial download of the metrics may take a while.


