| Issue |
A&A
Volume 625, May 2019
|
|
|---|---|---|
| Article Number | L3 | |
| Number of page(s) | 6 | |
| Section | Letters to the Editor | |
| DOI | https://doi.org/10.1051/0004-6361/201935556 | |
| Published online | 07 May 2019 | |
Letter to the Editor
Direct estimation of electron density in the Orion Bar PDR from mm-wave carbon recombination lines⋆
1
Instituto de Física Fundamental (IFF-CSIC), Calle Serrano 121-123, 28006 Madrid, Spain
e-mail: This email address is being protected from spambots. You need JavaScript enabled to view it.
2
Leiden Observatory, Leiden University, PO Box 9513, 2300 RA Leiden, The Netherlands
3
Centro de Astrobiología (CSIC-INTA), Ctra. de Torrejón a Ajalvir, km 4, 28850, Torrejón de Ardoz Madrid, Spain
Received:
27
March
2019
Accepted:
16
April
2019
Abstract
Context. A significant fraction of the molecular gas in star-forming regions is irradiated by stellar UV photons. In these environments, the electron density (ne) plays a critical role in the gas dynamics, chemistry, and collisional excitation of certain molecules.
Aims. We determine ne in the prototypical strongly irradiated photodissociation region (PDR), the Orion Bar, from the detection of new millimeter-wave carbon recombination lines (mmCRLs) and existing far-IR [13C II] hyperfine line observations.
Methods. We detect 12 mmCRLs (including α, β, and γ transitions) observed with the IRAM 30 m telescope, at ∼25″ angular resolution, toward the H/H2 dissociation front (DF) of the Bar. We also present a mmCRL emission cut across the PDR.
Results. These lines trace the C+/C/CO gas transition layer. As the much lower frequency carbon radio recombination lines, mmCRLs arise from neutral PDR gas and not from ionized gas in the adjacent H II region. This is readily seen from their narrow line profiles (Δv = 2.6 ± 0.4 km s−1) and line peak velocities (vLSR = +10.7 ± 0.2 km s−1). Optically thin [13C II] hyperfine lines and molecular lines – emitted close to the DF by trace species such as reactive ions CO+ and HOC+ – show the same line profiles. We use non-LTE excitation models of [13C II] and mmCRLs and derive ne = 60–100 cm−3 and Te = 500–600 K toward the DF.
Conclusions. The inferred electron densities are high, up to an order of magnitude higher than previously thought. They provide a lower limit to the gas thermal pressure at the PDR edge without using molecular tracers. We obtain Pth ≥ (2−4) × 108 cm−3 K assuming that the electron abundance is equal to or lower than the gas-phase elemental abundance of carbon. Such elevated thermal pressures leave little room for magnetic pressure support and agree with a scenario in which the PDR photoevaporates.
Key words: astrochemistry / photon-dominated region / HII regions / ISM: clouds
Based on observations obtained with the IRAM 30 m telescope supported by INSU/CNRS (France), MPG (Germany), and IGN (Spain).
© ESO 2019
1. Introduction
Much of the mass and most of the volume occupied by molecular gas in star-forming regions lies at low visual extinction (AV < 6, e.g., Pety et al. 2017). This means that, in the vicinity of OB-type massive stars, a significant fraction of the molecular gas is irradiated by relatively intense UV photon fluxes (e.g., Goicoechea et al. 2019). The interface layers between the hot ionized gas and the cold molecular cloud are photodissociation regions (PDRs; Hollenbach & Tielens 1999). PDRs host the critical H+/H/H2 and C+/C/CO transition layers of the interstellar medium (ISM). Far-UV (FUV) photons with E < 13.6 eV permeate molecular clouds, ionizing atoms, molecules, and dust grains of lower ionization potential (IPs). One signature of FUV-irradiated gas is an ionization fraction, defined as the abundance of electrons with respect to H nuclei (xe = ne/nH), higher than about 10−6. Cold molecular cores shielded from external FUV radiation show much lower ionization fractions, xe ≲ 10−8, as the abundance of electrons is driven by the gentle flux of cosmic-ray particles rather than penetrating stellar FUV photons (Guelin et al. 1982; Caselli et al. 1998; Maret & Bergin 2007; Goicoechea et al. 2009).
Electrons play a fundamental role in the chemistry and dynamics of the neutral interstellar gas (meaning neutral atomic or molecular hydrogen, but not ionized). The electron density (ne) controls the preponderance of ion-neutral reactions, i.e., the main formation route for many ISM molecules (Herbst & Klemperer 1973; Oppenheimer & Dalgarno 1974). The ionization fraction also controls the coupling of matter and magnetic fields. In addition, in high xe environments, the large cross sections for inelastic collisions of electrons with certain high-dipole molecules such as HCN provide an additional source of rotational excitation (Goldsmith & Kauffmann 2017). In these cases, the observed molecular line emission is no longer controlled by the most abundant collisional partner, H2. Hence, the actual value of ne affects how gas densities are estimated.
A direct determination of ne in molecular clouds is usually not possible and we have to rely on indirect methods such as the observation of molecular ions and chemical modeling. In FUV-illuminated environments, electrons are supplied by the photoionization of abundant elements such as carbon and sulfur (both with IP < 13.6 eV), and also by the photoelectric effect on dust grains and polycyclic aromatic hydrocarbon (PAH) molecules (Bakes & Tielens 1994). In diffuse and translucent clouds, and at the FUV-irradiated edges of dense molecular clouds, most electrons arise from the ionization of carbon atoms. Carbon recombination lines (CRLs), in which a free electron recombines with carbon ions (C+) and cascades down from Rydberg electronic states to the ground while emitting photons, are expected to arise from neutral gas close to the C+/C/CO transition layer (e.g., Natta et al. 1994) and not from the hot (electron temperature Te ≈ 10 000 K) ionized gas in the adjacent H II region. This is readily seen from the narrower CRLs profiles compared to the broad H and He recombination lines (Δv ≳ 20 km s−1, e.g., Churchwell et al. 1978). This conclusion is also in line with photoionization models where, in H II regions, carbon is mainly in the form of higher ionization states (e.g., C++) (Rubin et al. 1991; Kaufman et al. 2006).
The 2P3/2−2P1/2 fine-structure emission of singly ionized carbon (IP = 11.3 eV), the famous [C II] 158 μm line, is bright and often shows an intensity linearly proportional to the C+ column density (the so-called effectively thin emission regime; Goldsmith et al. 2012). However, the line reaches moderate opacities toward bright and dense PDRs such as the Orion Bar (e.g., Ossenkopf et al. 2013; Goicoechea et al. 2015). Carbon recombination lines are optically thin (see Sect. 4) with an intensity proportional to  . Although much fainter, mmCRLs can be observed from ground-based telescopes and can be used to infer ne and Te in FUV-irradiated neutral gas (Pankonin & Walmsley 1978; Salgado et al. 2017; Salas et al. 2018). CRLs have historically been detected at very low radio frequencies (e.g., at ∼43 MHz for C539α or ∼8.6 GHz for C91α). Pushing to higher frequencies (i.e., lower principal quantum numbers n) greatly improves the angular resolution of the observation even with single-dish telescopes. This allows us to access much smaller spatial scales and, potentially, to spatially resolve the narrow C+/C/CO gas transition layer.
In this work we present the detection of several α (Δn = 1), β (Δn = 2), and γ (Δn = 3) mmCRLs (CnΔn) observed from ∼85 GHz to ∼115 GHz toward the strongly FUV-irradiated (G0 ≳ 104) PDR, the Orion Bar. This is a nearly edge-on interface of the Orion molecular cloud (OMC-1) with the “Huygens” dense H II region, photoionized by young massive stars in the Trapezium cluster (e.g., Tielens et al. 1993; O’Dell 2001; Goicoechea et al. 2016; Pabst et al. 2019). Using the Effelsberg 100 m telescope, Natta et al. (1994) previously detected the C91α line toward several positions of the irradiated surface of OMC-1. The same line was mapped with the VLA along the Bar by Wyrowski et al. (1997). They showed that the C91α emission basically coincides with the emission in the v = 1–0 S(1) line from vibrationally excited molecular hydrogen (H ). Most models of the Bar use ne = 10 cm−3 for the edge of the PDR (e.g., van der Tak et al. 2012, 2013). This value implies relatively low gas densities (nH ≃ 105 cm−3) and thermal pressures in the CRL emitting layers, and through the PDR if the classical constant-density PDR model is adopted. The newly detected mmCRLs allow us to determine ne and Te, and to independently estimate the gas thermal pressure. This provides additional insights into the PDR structure and dynamics.
2. Observations and data reduction
We used the IRAM 30 m telescope at Pico Veleta (Sierra Nevada, Spain) to observe the Orion Bar in the mm band. We employed the E0 EMIR receiver (80 GHz−116 GHz) and fast Fourier transform spectrometer (FFTS) backend at 200 kHz spectral resolution (0.7 km s−1 at 90 GHz). These observations are part of a complete line survey (80 GHz−360 GHz; Cuadrado et al. 2015, 2016, 2017) toward a position close to the H2 dissociation front (DF; the H/H2 transition layer), almost coincident with what is known as the CO+ emission peak (Stoerzer et al. 1995). Here we present results obtained from deep observations in the 3 mm band toward three positions across the PDR (see Fig. 1). Their offsets with respect to  ,
,  are (+10″, −10″) = DF, (+30″, −30″), and (+35″, −55″). In order to avoid the extended emission from OMC-1, we employed the position switching observing procedure with a reference position at offset (−600″, 0″).
The half power beam width (HPBW) at 3 mm ranges from ∼31″ to ∼21″ (see Table A.1). We reduced and analyzed the data using the GILDAS software1, as described in Cuadrado et al. (2015). The rms noise obtained after 4 h−5 h integrations is typically ∼1 mK−5 mK per resolution channel. The antenna temperature,  , was converted to the main beam temperature, TMB, through the
  relation, where ηMB is the antenna efficiency, which is defined as the ratio between main beam efficiency, Beff, and forward efficiency, Feff
2. All line intensities in figures and tables are in units of main beam temperature.
relation, where ηMB is the antenna efficiency, which is defined as the ratio between main beam efficiency, Beff, and forward efficiency, Feff
2. All line intensities in figures and tables are in units of main beam temperature.
The intensities of the Cnα lines were extracted from a two-Gaussian fit to each observed feature: one narrow Gaussian for the Cnα lines, and a broader one for the Henα lines (see fits in Fig. A.1). With these fits we determined the contribution, ≈40%, of the Henα line wings to the observed emission at Cnα velocities. We used this value to estimate the contribution of the putative Henβ and Henγ line wings to the faint Cnβ and Cnγ lines. We conclude that the uncertainty (calibration and line overlap) of our mmCRL intensities is ≈15%. The resulting mmCRL spectroscopic parameters are given in Table A.1.
We also made use of the [13C II] map taken by Herschel/HIFI toward OMC-1 (Goicoechea et al. 2015). We analyzed the strongest, yet optically thin, [13C II] F =2–1 hyperfine emission component at 1900.466 GHz (red contours in Fig. 1). To make a comparison with the mmCRLs, we smoothed the map to an angular resolution of ∼25″ and extracted the [13C II] (F =2–1) integrated line intensity, 20 ± 3 K km s−1, toward the DF.
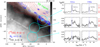 |
Fig. 1. Detection of mmCRLs toward the Orion Bar PDR. Left: map of the 13CO J = 3 – 2 integrated emission obtained with the IRAM 30 m telescope at a HPBW of 8″ (Cuadrado et al., in prep.). The blue dashed contours show the position of the H2 dissociation front traced by the H2v = 1 – 0 S(1) emission (from 1.5 to 4.5 × 10⁻⁴ erg s−1 cm−2 sr−1 in steps of 0.5 × 10⁻⁴ erg s−1 cm−2 sr−1; from Walmsley et al. 2000). Red contours show the [13C II] (2P3/2−2P1/2, F = 2–1) line emission at 1900.466 GHz mapped with Herschel/HIFI at a HPBW of 12″ (from 10 to 30 K km s−1 in steps of 2.5 K km s−1; from Goicoechea et al. 2015). Right: C41α and C39α recombination lines detected with the IRAM 30 m telescope toward three positions of the PDR. The cyan circles roughly represent the HPBW of our 3 mm-wave observations. |
3. Results
Figure 1 shows the observed positions over a map of the optically thin 13CO (J = 3-2) and [13C II] (2P3/2−2P1/2, F = 2–1) emission lines along the Bar. We detect 12 mmCRLs toward the DF: C42α to C38α, C52β to C48β, and C60γ to C59γ. All lines are shown in Fig. A.1. The emission from these lines gets fainter as we go from the DF to the more shielded molecular gas, thus mmCRLs trace the FUV-irradiated edge of the molecular cloud. The Cnα lines show an emission shoulder shifted by ≃+10 km s−1. This feature is produced by He recombination lines (IP = 24.6 eV). Helium lines do not arise from the neutral PDR; they are emitted from the surrounding “Huygens” H II region and from foreground layers of ionized gas that extend all the way to the edge of Orion’s Veil (see, e.g., Rubin et al. 2011; O’Dell et al. 2017; Pabst et al. 2019).
The observed mmCRLs have line profiles that are very different from those of H and He recombination lines (Fig. 2). The H and He recombination lines show much broader line widths (Δv = 10−30 km s−1) produced by the high electron temperatures and pressures of the fully ionized gas. They peak at vLSR = −2 to −11 km s−1, consistent with ionized gas that flows toward the observer. Carbon recombination lines, however, peak at vLSR = +10.7 ± 0.2 km s−1 and show narrow line profiles, Δv = 2.6 ± 0.4 km s−1. These values are nearly identical to those displayed by [13C II] and by molecular lines observed toward the DF position at comparable angular resolution (e.g., Cuadrado et al. 2015). In particular, mmCRLs and [13C II] line profiles are analogous to those of HOC+ and CO+ (Fig. 2). These reactive molecular ions form by chemical reactions involving C+ with H2O and OH, respectively (e.g., Fuente et al. 2003; Goicoechea et al. 2017). Hence, they likely trace the same gas component.
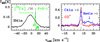 |
Fig. 2. Line profiles toward the Orion Bar (DF position). Left: H41α with Δv ≃ 26 km s−1 and vLSR ≃ −4 km s−1, and [13C II] (intensity divided by 30) with Δv ≃ 2.6 km s−1 (the [12C II] emission has been blanked out). Right: CO+N, F = 2, 5/2 – 1, 3/2 and C41α lines with Δv ≃ 2.6 km s−1. Dashed lines indicate the LSR velocity, 10.7 km s−1, of the PDR. |
For optically thin emission, line widths are determined by thermal broadening (∝  ) and by nonthermal broadening produced by gas turbulence and macroscopic motions in the PDR. Adopting a nonthermal velocity dispersion3 of σnth = 1.0 ± 0.1 km s−1 (Δvnth = 2.355 ⋅σnth), the observed mmCRL widths imply a beam-averaged gas temperature of
  K. The [C II] 158 μm line shows a broader line width, Δv = 4.1 ± 0.1 km s−1, toward the DF. Because the line emission is moderately optically thick (τ[CII] ≈ 1–2; see Ossenkopf et al. 2013; Goicoechea et al. 2015), these line width differences are, at least in part, produced by opacity-broadening of the [C II] 158 μm line. However, Ossenkopf et al. (2013) pointed out that opacity-broadening alone does not fully explain the broader [C II] line profile compared to [13C II]. These line width differences may suggest that, in comparison to [13C II] and mmCRLs, the [C II] 158 μm emission has a significant contribution from hotter gas in the mostly atomic PDR (xH > xH2), thus closer to the ionization front (the PDR/H II interface).
4. Analysis
Our 3 mm-wave observations have allowed us to detect several α, β, and γ CRLs toward the Bar. The observed n dependence of their line strengths is determined by the level populations. These can be modeled and used to derive ne and Te (see theory in e.g., Walmsley & Watson 1982; Salgado et al. 2017).
Figure 3 shows results of a grid of non-LTE4 excitation models for ne ranging from 1 cm−3 to 500 cm−3, and Te ranging from 100 K to 1000 K. Our models use non-LTE level populations computed by Salgado et al. (2017) without a background radiation field. Models assume that the observed lines are optically thin (for the conditions prevailing in the Bar, we determine that the opacity of the C41α line is τ ≃ 10−2). Our models also compute the [13C II] 2P3−2−2P1/2 excitation, and use the [12C/13C] ≃ 67 isotopic abundance ratio inferred in Orion (Langer et al. 1984). The colored area in Fig. 3 shows the best models fitting line intensity ratios that include all5 observed α, β, and γ mmCRLs and [13C II]. The black line shows where the gas thermal pressure (Pth = nH ⋅ Tk) is 2 × 108 cm−3 K. To plot this line we assume xe = xC+ = [C/H]; in other words, all free electrons come from the ionization of carbon atoms, with an gas-phase abundance of [C/H] = 1.4 × 10⁻⁴ with respect to H nuclei in Orion (Sofia et al. 2004). Absolute line intensity predictions depend on the assumed path-length l along the line of sight. The ∼25″ beam-averaged C+ column density, N(C+), estimated from [13C II] is N(C+) ≃ 1019 cm−2 (Goicoechea et al. 2015). Assuming a representative density of nH ≃ 105 cm−3 in the atomic PDR (Tielens et al. 1993), the inferred N(C+) is equivalent to l ≃ 0.2 pc. This is consistent with other estimations based on the infrared dust emission (l = 0.28 ± 0.06 pc, Salgado et al. 2016). If the gas density is a factor of ten higher (e.g., Andree-Labsch et al. 2017) then l ≃ 0.02 pc.
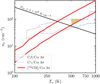 |
Fig. 3. Constraints on ne and Te toward the Orion Bar DF from non-LTE excitation models that assume a path length of 0.02 ≤ l ≤ 0.2 pc. The colored area shows the overlap region of models for different line intensity ratios (within a 3σ uncertainty range in the observed ratios). |
Our absolute intensity and line ratio models restrict ne and Te toward the DF position to 60–100 cm−3 and 500–600 K, respectively. The inferred electron temperatures in the colored area of Fig. 3 fall within the thermal line widths derived from the observed mmCRL profiles (see previous section). Assuming6xe ≤ 1.4 × 10⁻⁴, the derived electron densities are equivalent to gas densities of nH ≥ (4−7) × 105 cm−3. Thus, gas thermal pressures of Pth ≥ (2−4) × 108 cm−3 K toward the DF.
5. Discussion and prospects
Using mmCRL observations and models, we inferred ne = 60–100 cm−3 at the H/H2 dissociation front of the Orion Bar PDR. These electron densities are higher than the ≃10 cm−3 values typically used in molecular excitation models of the region (e.g., van der Tak et al. 2012, 2013). In addition, by assuming xe ≤ 1.4 × 10⁻⁴, we estimated a lower limit6 to Pth in the DF. The high inferred gas thermal pressures confirm earlier estimations based on the analysis of ALMA images of the molecular gas emission (Goicoechea et al. 2016, 2017) and of Herschel observations of specific tracers of the DF (e.g., high-J CO and CH+ rotational lines; Nagy et al. 2013; Joblin et al. 2018). Nonstationary photoevaporating PDR models (e.g., Bertoldi & Draine 1996; Bron et al. 2018) predict such high pressures in PDRs. In these time-dependent models, the strong stellar FUV field heats, compresses, and gradually evaporates the molecular cloud edge if the pressure of the surrounding medium (the adjacent H II region) is not significantly higher. The derived thermal pressure toward the DF, Pth ≳ 2 × 108 cm−3 K, is indeed higher than that of the ionized gas at the ionization front (≈6 × 107 cm−3 K, Walmsley et al. 2000) and, in contrast to previous indirect studies of the pressure in the Bar (Pellegrini et al. 2009), leaves little room for magnetic pressure support. This conclusion is in line with the relatively modest plane-of-the-sky magnetic field strength reported from far-IR polarimetric observations with SOFIA/HAWC+ (Chuss et al. 2019).
Unfortunately, the ∼25″ resolution of our single-dish observations does not allow us to spatially resolve the [13C II] and mmCRLs emitting layers. We note that AV = 1, roughly the width of the H/H2 transition layer, implies 3.2″ − 1.6″ for nH = 105 and 106 cm−3, respectively. The ∼10″ resolution VLA map of the C91α line (Wyrowski et al. 1997) shows that the C+ gas layer seen in this CRL is spatially coincident with the IR emission from H that traces the H/H2 dissociation front (shown in Fig. 1). This result is somewhat surprising because constant-density stationary PDR models have long predicted that the C+/C/CO transition in the Bar should be located deeper inside the cloud, and separated from the DF by several arcsec (e.g., Tielens et al. 1993). In addition, single-dish observations show that the [C I] 492 GHz emission spatially correlates with that of 13CO (J = 2–1) (Tauber et al. 1995). This suggests that the classical C+/C/CO sandwich structure of a PDR may not be discernible, or even exist, in the sense that there would be no layer in the Bar where neutral atomic carbon is the most abundant carbon reservoir. Indeed, ALMA images of the Bar at ≈1″ resolution show that there is also no appreciable offset between the H
 emission and the edge of the HCO+ and CO emission (Goicoechea et al. 2016). All these new observations thus suggest that we still do not fully understand the properties and exact location of the C+/C/CO transition in interstellar clouds.
In this work we provided evidence that the electron density at the edge of the Orion Bar PDR is quite high, and this may have consequences for the coupling of matter with the magnetic field and the excitation of certain molecules. Much higher resolution ALMA observations of mmCRLs and of neutral atomic carbon [C I] fine-structure lines are clearly needed to spatially resolve these critical interface layers of the ISM.
Calculated from detailed nonlocal radiative transfer models of the molecular line emission toward the DF (Goicoechea et al. 2016, 2017).
The observed mmCRL intensity ratios approach LTE for Te ≳ 500 K. Assuming LTE excitation results in mmCRL intensities brighter by ≲25%. Hence, the estimated ne in LTE are ≲25% lower.
The properties of the observed α, β, and γ carbon recombination lines vary slowly with n. In order to increase the statistical significance of our comparison between models and observations, we used the inverse-variance weighted intensity averages of the observed Cnα (n from 38 to 42), Cnβ (n from 48 to 52), and Cnγ (n from 59 to 60) lines.
Our inferred nH and Pth values are lower limits if mmCRLs arise from PDR gas layers where a significant fraction of carbon is not locked in C+, and thus xe < 1.4 × 10⁻⁴ and xe > x(C+).
Acknowledgments
We thank the Spanish MICIU for funding support under grant AYA2017-85111-P and the ERC for support under grant ERC-2013-Syg-610256-NANOCOSMOS. A.B.-R. also acknowledges support by the MICIU and FEDER funding under grants ESP2015-65597-C4-1-R and ESP2017-86582-C4-1-R. P.S. and A.G.G.M.T. acknowledge financial support from the Dutch Science Organisation through TOP grant 614.001.351.
References
- Andree-Labsch, S., Ossenkopf-Okada, V., & Röllig, M. 2017, A&A, 598, A2 [NASA ADS] [CrossRef] [EDP Sciences] [Google Scholar]
- Bakes, E. L. O., & Tielens, A. G. G. M. 1994, ApJ, 427, 822 [NASA ADS] [CrossRef] [Google Scholar]
- Bertoldi, F., & Draine, B. T. 1996, ApJ, 458, 222 [NASA ADS] [CrossRef] [Google Scholar]
- Bron, E., Agúndez, M., Goicoechea, J. R., & Cernicharo, J. 2018, A&A, submitted [arXiv:1801.01547] [Google Scholar]
- Caselli, P., Walmsley, C. M., Terzieva, R., & Herbst, E. 1998, ApJ, 499, 234 [NASA ADS] [CrossRef] [Google Scholar]
- Churchwell, E., Smith, L. F., Mathis, J., Mezger, P. G., & Huchtmeier, W. 1978, A&A, 70, 719 [NASA ADS] [Google Scholar]
- Chuss, D. T., Andersson, B.-G., Bally, J., et al. 2019, ApJ, 872, 187 [NASA ADS] [CrossRef] [Google Scholar]
- Cuadrado, S., Goicoechea, J. R., Pilleri, P., et al. 2015, A&A, 575, A82 [NASA ADS] [CrossRef] [EDP Sciences] [Google Scholar]
- Cuadrado, S., Goicoechea, J. R., Roncero, O., et al. 2016, A&A, 596, L1 [NASA ADS] [CrossRef] [EDP Sciences] [Google Scholar]
- Cuadrado, S., Goicoechea, J. R., Cernicharo, J., et al. 2017, A&A, 603, A124 [NASA ADS] [CrossRef] [EDP Sciences] [Google Scholar]
- Fuente, A., Rodríguez-Franco, A., García-Burillo, S., Martín-Pintado, J., & Black, J. H. 2003, A&A, 406, 899 [NASA ADS] [CrossRef] [EDP Sciences] [Google Scholar]
- Goicoechea, J. R., Pety, J., Gerin, M., et al. 2009, A&A, 498, 771 [NASA ADS] [CrossRef] [EDP Sciences] [Google Scholar]
- Goicoechea, J. R., Teyssier, D., Etxaluze, M., et al. 2015, ApJ, 812, 75 [NASA ADS] [CrossRef] [Google Scholar]
- Goicoechea, J. R., Pety, J., Cuadrado, S., et al. 2016, Nature, 537, 207 [NASA ADS] [CrossRef] [Google Scholar]
- Goicoechea, J. R., Cuadrado, S., Pety, J., et al. 2017, A&A, 601, L9 [NASA ADS] [CrossRef] [EDP Sciences] [Google Scholar]
- Goicoechea, J. R., Santa-Maria, M. G., Bron, E., et al. 2019, A&A, 622, A91 [NASA ADS] [CrossRef] [EDP Sciences] [Google Scholar]
- Goldsmith, P. F., & Kauffmann, J. 2017, ApJ, 841, 25 [NASA ADS] [CrossRef] [Google Scholar]
- Goldsmith, P. F., Langer, W. D., Pineda, J. L., & Velusamy, T. 2012, ApJ, 203, 13 [Google Scholar]
- Guelin, M., Langer, W. D., & Wilson, R. W. 1982, A&A, 107, 107 [NASA ADS] [Google Scholar]
- Herbst, E., & Klemperer, W. 1973, ApJ, 185, 505 [NASA ADS] [CrossRef] [Google Scholar]
- Hollenbach, D. J., & Tielens, A. G. G. M. 1999, Rev. Mod. Phys., 71, 173 [Google Scholar]
- Joblin, C., Bron, E., Pinto, C., et al. 2018, A&A, 615, A129 [NASA ADS] [CrossRef] [EDP Sciences] [Google Scholar]
- Kaufman, M. J., Wolfire, M. G., & Hollenbach, D. J. 2006, ApJ, 644, 283 [NASA ADS] [CrossRef] [Google Scholar]
- Langer, W. D., Graedel, T. E., Frerking, M. A., & Armentrout, P. B. 1984, ApJ, 277, 581 [NASA ADS] [CrossRef] [Google Scholar]
- Maret, S., & Bergin, E. A. 2007, ApJ, 664, 956 [NASA ADS] [CrossRef] [Google Scholar]
- Nagy, Z., Van der Tak, F. F. S., Ossenkopf, V., et al. 2013, A&A, 550, A96 [NASA ADS] [CrossRef] [EDP Sciences] [Google Scholar]
- Natta, A., Walmsley, C. M., & Tielens, A. G. G. M. 1994, ApJ, 428, 209 [NASA ADS] [CrossRef] [Google Scholar]
- O’Dell, C. R. 2001, ARA&A, 39, 99 [NASA ADS] [CrossRef] [Google Scholar]
- O’Dell, C. R., Kollatschny, W., & Ferland, G. J. 2017, ApJ, 837, 151 [NASA ADS] [CrossRef] [Google Scholar]
- Oppenheimer, M., & Dalgarno, A. 1974, ApJ, 192, 29 [NASA ADS] [CrossRef] [Google Scholar]
- Ossenkopf, V., Röllig, M., Neufeld, D. A., et al. 2013, A&A, 550, A57 [NASA ADS] [CrossRef] [EDP Sciences] [Google Scholar]
- Pabst, C., Higgins, R., Goicoechea, J. R., et al. 2019, Nature, 565, 618 [NASA ADS] [CrossRef] [Google Scholar]
- Pankonin, V., & Walmsley, C. M. 1978, A&A, 67, 129 [NASA ADS] [Google Scholar]
- Pellegrini, E. W., Baldwin, J. A., Ferland, G. J., et al. 2009, ApJ, 693, 285 [NASA ADS] [CrossRef] [Google Scholar]
- Pety, J., Guzmán, V. V., Orkisz, J. H., et al. 2017, A&A, 599, A98 [NASA ADS] [CrossRef] [EDP Sciences] [Google Scholar]
- Rubin, R. H., Simpson, J. P., Haas, M. R., & Erickson, E. F. 1991, ApJ, 374, 564 [NASA ADS] [CrossRef] [Google Scholar]
- Rubin, R. H., Simpson, J. P., O’Dell, C. R., et al. 2011, MNRAS, 410, 1320 [NASA ADS] [CrossRef] [Google Scholar]
- Salas, P., Oonk, J. B. R., van Weeren, R. J., et al. 2018, MNRAS, 475, 2496 [NASA ADS] [CrossRef] [Google Scholar]
- Salgado, F., Berné, O., Adams, J. D., et al. 2016, ApJ, 830, 118 [NASA ADS] [CrossRef] [Google Scholar]
- Salgado, F., Morabito, L. K., Oonk, J. B. R., et al. 2017, ApJ, 837, 141 [NASA ADS] [CrossRef] [Google Scholar]
- Sofia, U. J., Lauroesch, J. T., Meyer, D. M., & Cartledge, S. I. B. 2004, ApJ, 605, 272 [NASA ADS] [CrossRef] [Google Scholar]
- Stoerzer, H., Stutzki, J., & Sternberg, A. 1995, A&A, 296, L9 [NASA ADS] [Google Scholar]
- Tauber, J. A., Lis, D. C., Keene, J., Schilke, P., & Büttgenbach, T. H. 1995, A&A, 297, 567 [NASA ADS] [Google Scholar]
- Tielens, A. G. G. M., Meixner, M. M., van der Werf, P. P., et al. 1993, Science, 262, 86 [NASA ADS] [CrossRef] [PubMed] [Google Scholar]
- van der Tak, F. F. S., Ossenkopf, V., Nagy, Z., et al. 2012, A&A, 537, L10 [NASA ADS] [CrossRef] [EDP Sciences] [Google Scholar]
- van der Tak, F. F. S., Nagy, Z., Ossenkopf, V., et al. 2013, A&A, 560, A95 [NASA ADS] [CrossRef] [EDP Sciences] [Google Scholar]
- Walmsley, C. M., & Watson, W. D. 1982, ApJ, 260, 317 [NASA ADS] [CrossRef] [Google Scholar]
- Walmsley, C. M., Natta, A., Oliva, E., & Testi, L. 2000, A&A, 364, 301 [NASA ADS] [Google Scholar]
- Wyrowski, F., Schilke, P., Hofner, P., & Walmsley, C. M. 1997, ApJ, 487, L171 [NASA ADS] [CrossRef] [Google Scholar]
Appendix A: Additional table and figure
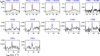 |
Fig. A.1. Carbon recombination lines between 80 GHz and 116 GHz detected with the IRAM 30 m telescope toward the Orion Bar (DF position). The dashed lines indicate the LSR velocity (10.7 km s−1) of the molecular gas in the PDR. The red and green curves show Gaussian fits to the Cnα and Henα lines, respectively. We use these fits to determine the contribution of He recombination line wings to the emission observed in the velocity range of the Cnβ and Cnγ lines. We note the different abscissa and ordinate axis scales. |
Line spectroscopic parameters obtained from Gaussian fits to the observed mmCRLs (see Sect. 2).
All Tables
Line spectroscopic parameters obtained from Gaussian fits to the observed mmCRLs (see Sect. 2).
All Figures
|
Fig. 1. Detection of mmCRLs toward the Orion Bar PDR. Left: map of the 13CO J = 3 – 2 integrated emission obtained with the IRAM 30 m telescope at a HPBW of 8″ (Cuadrado et al., in prep.). The blue dashed contours show the position of the H2 dissociation front traced by the H2v = 1 – 0 S(1) emission (from 1.5 to 4.5 × 10⁻⁴ erg s−1 cm−2 sr−1 in steps of 0.5 × 10⁻⁴ erg s−1 cm−2 sr−1; from Walmsley et al. 2000). Red contours show the [13C II] (2P3/2−2P1/2, F = 2–1) line emission at 1900.466 GHz mapped with Herschel/HIFI at a HPBW of 12″ (from 10 to 30 K km s−1 in steps of 2.5 K km s−1; from Goicoechea et al. 2015). Right: C41α and C39α recombination lines detected with the IRAM 30 m telescope toward three positions of the PDR. The cyan circles roughly represent the HPBW of our 3 mm-wave observations. |
| In the text | |
|
Fig. 2. Line profiles toward the Orion Bar (DF position). Left: H41α with Δv ≃ 26 km s−1 and vLSR ≃ −4 km s−1, and [13C II] (intensity divided by 30) with Δv ≃ 2.6 km s−1 (the [12C II] emission has been blanked out). Right: CO+N, F = 2, 5/2 – 1, 3/2 and C41α lines with Δv ≃ 2.6 km s−1. Dashed lines indicate the LSR velocity, 10.7 km s−1, of the PDR. |
| In the text | |
|
Fig. 3. Constraints on ne and Te toward the Orion Bar DF from non-LTE excitation models that assume a path length of 0.02 ≤ l ≤ 0.2 pc. The colored area shows the overlap region of models for different line intensity ratios (within a 3σ uncertainty range in the observed ratios). |
| In the text | |
|
Fig. A.1. Carbon recombination lines between 80 GHz and 116 GHz detected with the IRAM 30 m telescope toward the Orion Bar (DF position). The dashed lines indicate the LSR velocity (10.7 km s−1) of the molecular gas in the PDR. The red and green curves show Gaussian fits to the Cnα and Henα lines, respectively. We use these fits to determine the contribution of He recombination line wings to the emission observed in the velocity range of the Cnβ and Cnγ lines. We note the different abscissa and ordinate axis scales. |
| In the text | |
Current usage metrics show cumulative count of Article Views (full-text article views including HTML views, PDF and ePub downloads, according to the available data) and Abstracts Views on Vision4Press platform.
Data correspond to usage on the plateform after 2015. The current usage metrics is available 48-96 hours after online publication and is updated daily on week days.
Initial download of the metrics may take a while.