Fig. 1.
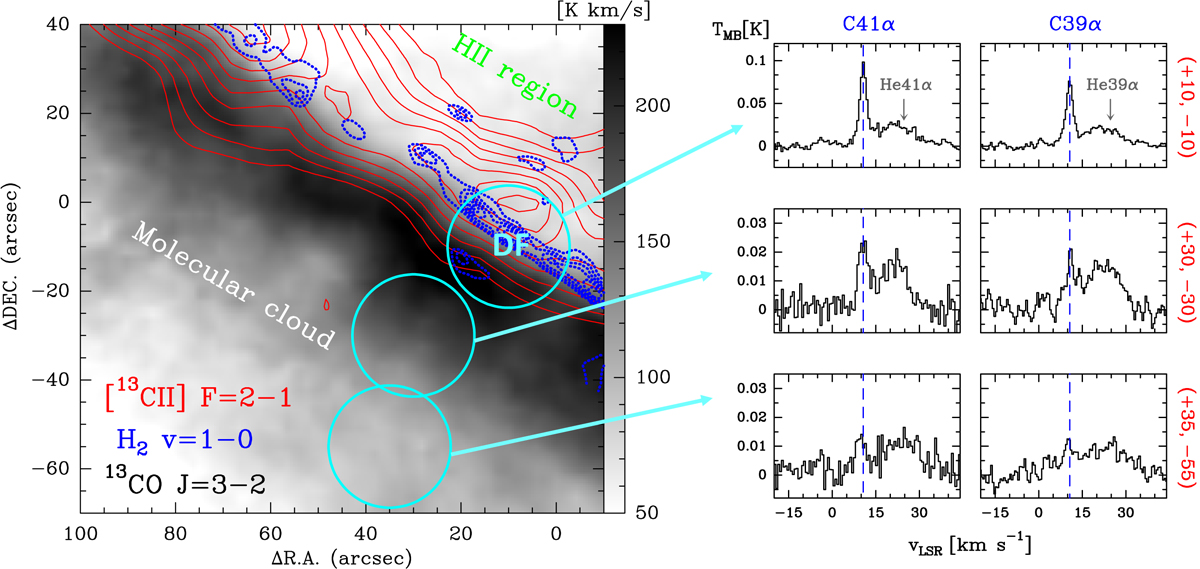
Detection of mmCRLs toward the Orion Bar PDR. Left: map of the 13CO J = 3 – 2 integrated emission obtained with the IRAM 30 m telescope at a HPBW of 8″ (Cuadrado et al., in prep.). The blue dashed contours show the position of the H2 dissociation front traced by the H2v = 1 – 0 S(1) emission (from 1.5 to 4.5 × 10⁻⁴ erg s−1 cm−2 sr−1 in steps of 0.5 × 10⁻⁴ erg s−1 cm−2 sr−1; from Walmsley et al. 2000). Red contours show the [13C II] (2P3/2−2P1/2, F = 2–1) line emission at 1900.466 GHz mapped with Herschel/HIFI at a HPBW of 12″ (from 10 to 30 K km s−1 in steps of 2.5 K km s−1; from Goicoechea et al. 2015). Right: C41α and C39α recombination lines detected with the IRAM 30 m telescope toward three positions of the PDR. The cyan circles roughly represent the HPBW of our 3 mm-wave observations.
Current usage metrics show cumulative count of Article Views (full-text article views including HTML views, PDF and ePub downloads, according to the available data) and Abstracts Views on Vision4Press platform.
Data correspond to usage on the plateform after 2015. The current usage metrics is available 48-96 hours after online publication and is updated daily on week days.
Initial download of the metrics may take a while.