| Issue |
A&A
Volume 625, May 2019
|
|
|---|---|---|
| Article Number | L1 | |
| Number of page(s) | 9 | |
| Section | Letters to the Editor | |
| DOI | https://doi.org/10.1051/0004-6361/201935296 | |
| Published online | 30 April 2019 | |
Letter to the Editor
Observational evidence of third dredge-up occurrence in S-type stars with initial masses around 1 M⊙⋆
1
Institute of Astronomy and Astrophysics (IAA), Université libre de Bruxelles (ULB), CP 226, Boulevard du Triomphe, 1050 Bruxelles, Belgium
e-mail: This email address is being protected from spambots. You need JavaScript enabled to view it.
2
Institute of Astronomy, KU Leuven, Celestijnenlaan 200D, 3001 Leuven, Belgium
Received:
18
February
2019
Accepted:
8
April
2019
Abstract
Context. S stars are late-type giants with spectra showing characteristic molecular bands of ZrO in addition to the TiO bands typical of M stars. Their overabundance pattern shows the signature of s-process nucleosynthesis. Intrinsic, technetium (Tc)-rich S stars are the first objects on the asymptotic giant branch (AGB) to undergo third dredge-up (TDU) events. Exquisite Gaia parallaxes now allow for these stars to be precisely located in the Hertzsprung–Russell (HR) diagram. Here we report on a population of low-mass, Tc-rich S stars previously unaccounted for by stellar evolution models.
Aims. Our aim is to derive parameters for a sample of low-mass, Tc-rich S stars and then, by comparing their location in the HR diagram with stellar evolution tracks, to derive their masses and to compare their measured s-process abundance profiles with recently derived STAREVOL nucleosynthetic predictions for low-mass AGB stars.
Methods. Stellar parameters were obtained using a combination of HERMES high-resolution spectra, accurate Gaia Data Release 2 (Gaia-DR2) parallaxes, stellar-evolution models, and newly designed MARCS model atmospheres for S-type stars.
Results. We report on six Tc-rich S stars lying close to the 1 M⊙ (initial mass) tracks of AGB stars of the corresponding metallicity and above the predicted onset of TDU, as expected. This provides direct evidence for TDUs occurring in AGB stars with initial masses as low as ∼1 M⊙ and at low luminosity, that is, at the start of the thermally pulsing AGB. We present AGB models producing TDU in those stars with [Fe/H] in the range −0.25 to −0.5. There is reasonable agreement between the measured and predicted s-process abundance profiles. For two objects however, CD −29°5912 and BD +34°1698, the predicted C/O ratio and s-process enhancements do not simultaneously match the measured ones.
Key words: stars: abundances / stars: AGB and post-AGB / Hertzsprung–Russell and C–M diagrams / nuclear reactions / nucleosynthesis / abundances / stars: interiors
Based on observations made with the Mercator Telescope, operated on the island of La Palma by the Flemish Community, at the Spanish Observatorio del Roque de los Muchachos of the Instituto de Astrofísica de Canarias.
© ESO 2019
1. Introduction
S-type stars are characterized by the presence of ZrO molecular bands on top of the TiO bands typical of M-type giants (Merrill 1922), along with a carbon/oxygen ratio (C/O) in between those of M-type stars (∼0.5) and carbon stars (> 1). s-process elements produced during the asymptotic giant branch (AGB) phase are overabundant in their atmospheres (Smith & Lambert 1990). The fact that technetium (Tc), an s-process element with no stable isotopes, is detected in some but not all S stars remained a puzzle until it was discovered that Tc-rich S stars are thermally pulsing AGB (TP-AGB) stars undergoing s-process nucleosynthesis and third dredge-up (TDU) events, while Tc-poor S stars are less evolved stars owing their s-process enrichment to pollution from a former AGB companion which has now turned into an undetected white dwarf (Jorissen & Mayor 1988; Smith & Lambert 1988; Jorissen et al. 1993; Van Eck & Jorissen 1999, 2000; Van Eck et al. 2000). Enough time has elapsed since the mass transfer for Tc to decay completely. Hence, S stars can be divided into two groups, the intrinsic Tc-rich ones and the extrinsic binary ones with no Tc. S-type stars serve as important probes to understand AGB nucleosynthesis since intrinsic S stars are the first stars on the AGB to show signatures of TDU.
An intriguing challenge in our understanding of AGB nucleosynthesis and TDU episodes is the growing series of observations pointing at dredge-up occurring in low-mass stars (< 1.5 M⊙). Such evidence is now more robust thanks to Gaia parallaxes (Brown 2018) allowing for objects to be to precisely located in the Hertzsprung–Russell (HR) diagram (e.g., for S-type stars, Shetye et al. 2018; S18 hereafter). One example of such a low-mass (initial mass ∼1 M⊙) intrinsic S star is V915 Aql from the sample of S18 exhibiting s-process element enrichment (including Tc).
There have been previous mentions of low-mass stars experiencing dredge-up. For example, van Aarle et al. (2013) and De Smedt et al. (2015) reported strongly s-process-enriched and moderately metal-poor low-luminosity post-AGB stars as evidence of TDU in stars of low initial masses (∼1 M⊙).
On the contrary, standard stellar-evolution models at solar metallicity produce TDUs only in stars with initial masses larger than 1.4–1.5 M⊙ (Straniero et al. 2003; Bisterzo et al. 2010; Cristallo et al. 2015; Karakas & Lugaro 2016), with the exception of Weiss & Ferguson (2009) who found TDU already at 1 M⊙ for Z = 0.02, but allowing for some overshooting below the convective pulse. This minimum initial mass for the occurrence of TDU actually depends on the chemical composition, mass-loss rate, mixing prescriptions, and numerics. For example, the models of Lugaro et al. (2012) and Fishlock et al. (2014) encounter TDU at ∼1 M⊙ but for metallicities as low as [Fe/H] ∼ −2.3 and −1.2, respectively. Similarly, the AGB models of Stancliffe et al. (2005) and Weiss & Ferguson (2009) give rise to TDU at 1 M⊙ for the Large Magellanic Cloud (LMC) and Small Magellanic Cloud (SMC) metallicities (respectively Z = 0.008 and 0.004, as adopted for these computations, which for Z⊙ = 0.02 translates to [Fe/H]LMC = −0.4 and [Fe/H]SMC = −0.7). We moreover stress that Stancliffe et al. (2005) did not consider any mass loss at any stage of the evolution.
Here, we report on the analyses of six Tc-rich S stars in the solar neighbourhood. Thanks to the Gaia data release 2 (DR2) parallaxes, we compare the location of the sample stars in the HR diagram with the new AGB models computed using the STAREVOL code to determine their evolutionary masses. We further discuss the agreement between the measured s-process abundances and the nucleosynthesis predictions.
2. Observations
Among the Tc-rich S stars with an accurate Gaia DR2 parallax (i.e. matching the condition σϖ/ϖ ≤ 0.3) that we observed with the HERMES high-resolution spectrograph (Raskin et al. 2011), we selected the stars that appeared to have an initial mass around 1 M⊙. Our sample includes six low-mass Tc-rich S stars; V915 Aql, which was analysed in S18, is among them. In order to ensure Tc-line detectability, only spectra with a S/N larger than or equal to 30 in the V band were used. The observation log can be found in Table B.1. Stellar masses were obtained from the position of the stars in the HR diagram (with luminosities obtained from the Gaia DR2 parallaxes and stellar parameters as derived in Sect. 4) compared with the STAREVOL evolutionary tracks (see also S18 for more details about the way masses were derived). The parallaxes and other basic data of the sample stars can be found in Table B.1.
3. Technetium detection
The radio-isotope pairs Tc–Mo and Zr–Nb give a precise diagnostic to decide whether a star is currently experiencing s-process nucleosynthesis and dredge-ups (Mathews et al. 1986; Neyskens et al. 2015). Intrinsic S stars can thus be identified without ambiguity if they are enriched in Tc (Merrill 1952) but not in Nb (Neyskens et al. 2015; Karinkuzhi et al. 2018). We use the three strong Tc I resonance lines located at 4238.19 Å, 4262.27 Å, and 4297.06 Å. Though these lines are heavily blended with other (s-process) lines, their combination can be used reliably for the intrinsic/extrinsic classification. Figure C.1 displays the absorption features produced by the three lines for our sample stars and illustrates that they are all intrinsic S stars. Wang & Chen (2002) classified BD +34°1698 and HD 357941 as extrinsic S stars based on their location in the (K − [12],[12]−[25]) colour–index plane (where [12] and [25] are the IRAS magnitudes); however, our high-resolution spectra demonstrate without ambiguity that they are Tc-rich. The classification of CD −29 ° 5912 as an intrinsic S star is in agreement with the classification by Van Eck et al. (2017). There was no former classification available in the literature for CSS 182 and CSS 154.
The second diagnostic, based on the Nb abundance, is in perfect agreement with the Tc diagnostic, as will be shown in Sect. 5.
4. Stellar parameter determination
The atmospheric parameters {Teff, log g, [Fe/H], C/O, [s/Fe]}, where [s/Fe]1 is the s-process enhancement with respect to the (metallicity-scaled) solar s-process contribution, were derived as in S18. In summary, this method performs a χ2 adjustment between a grid of S-star MARCS synthetic spectra (Van Eck et al. 2017) and observed HERMES spectra within carefully selected spectral regions, also considering synthetic and observed photometric colour indices. Luminosity was calculated using the distances derived from the Gaia DR2 parallaxes, the reddening EB − V (retrieved from Gontcharov 2012), and the bolometric correction in the K-band as computed from the MARCS model atmospheres. The luminosity combined with Teff leads to a constraint on the stellar mass by comparing with STAREVOL evolutionary tracks, allowing us to re-evaluate the surface gravity. The parameter selection was iterated until the surface gravity derived from the spectroscopic adjustment matched the value derived from the stellar position in the HR diagram. The variations of the atmospheric parameters while iterating for log g are used as an estimate of the parameter uncertainty, as listed in Table B.2.
5. Abundance determination and uncertainties
The atomic abundances were derived by comparing observed and synthetic spectra generated by the Turbospectrum (Alvarez & Plez 1998; Plez 2012) spectral synthesis code on MARCS model atmospheres of S-type stars (Van Eck et al. 2017) with matching parameters. For V915 Aql, the stellar parameters and abundances from S18 were used.
C, N, O. The C/O ratio is obtained from the stellar parameter determination (Sect. 4). The oxygen abundance cannot be derived from the optical spectrum in S-type stars, hence its solar-scaled value at the stellar metallicity was adopted, thereby fixing the C abundance. The nitrogen abundance was derived from the CN lines in the 7900–8100 Å range. In particular, the lines listed in Merle et al. (2016) were used.
[Fe/H]. The metallicity was derived using ten or more Fe lines in the range 7300–8700 Å, as listed in Table E.1. The metallicities of the sample stars are listed in Col. 5 of Table B.2, along with their standard deviation.
Heavy elements. The spectra of S stars are dominated by molecular bands and unblended atomic s-process lines are rare (Smith & Lambert 1990). This is why a spectral-synthesis approach is required, as opposed to relying solely on equivalent widths. As in Neyskens et al. (2015), Karinkuzhi et al. (2018), and S18, we only used the two Zr I lines at 7819.37 AA and 7849.37 Å with transition probabilities from laboratory measurements (Biémont et al. 1981). The Y I and Y II available lines lie in regions subject to blending by molecular lines of ZrO. The Y abundance of BD +34°1698 could not be derived, presumably because of its higher Zr abundance coupled with a low temperature ([Zr/Fe] = 2.7, Teff = 3400 K; see Tables B.2 and B.3). The Ba abundance was derived for all stars using the 7488.077 Å Ba I line. We could not find any good Nd lines for BD +34°1698, HD 357941, or CSS 154, but for CSS 182 and CD −29°5912 at least five good lines were available. The other s-process element abundances were derived using the lines from Table E.1 and are listed in Table B.3.
All the sample stars show an overall mild enrichment of s-process elements. These results are also consistent with the moderate C/O ratios of these stars (0.5–0.75), indicating that they are at the very beginning of the TP-AGB.
Finally, Table B.3 confirms the Tc–Nb anti-correlation encountered in S stars (Neyskens et al. 2015), since all the Tc-rich stars of our sample are devoid of any significant Nb enhancement, whereas they show genuine Zr overabundances. This is evidence that the freshly produced 93Zr has not yet had time to decay to (mono-isotopic) Nb. Our classification (based on the Tc lines) of these objects as intrinsic TP-AGB stars is thus fully corroborated by the Nb diagnostic.
Abundance uncertainties. The atmospheric parameters of S stars are unfortunately degenerated, in the sense that different combinations of Teff, log g, and C/O may lead to similar line strengths. The effects of changing one of the stellar parameters may thus compensate for the others, meaning that the impact on abundances may be limited (see the discussion in S18 and Sect. 7). Therefore, quadratically adding the abundance uncertainties induced by each atmospheric-parameter variation within its uncertainty range would crudely overestimate the total error. To evaluate the abundance uncertainties, we instead used the method of Cayrel et al. (2004). This method involves finding a model (tagged “model H” in the list of Table B.4) that provides in a representative spectral region (around Zr I lines at 7819 Å and 7849 Å) an almost equally good spectral fit to the observed spectrum as our best model (tagged “model A”). The difference between the abundances derived from models H and A, together with the line-to-line scatter and the error due to continuum placement (0.1 dex), were quadratically added to estimate the total uncertainty on each elemental abundance. When only one spectral line was available for a given element, a standard line-to-line scatter of 0.1 dex was adopted. The effect on the abundances of the variation of individual atmospheric parameters can be found in Table B.4.
6. Comparison with STAREVOL nucleosynthesis predictions
We computed low-mass AGB models in order to compare the measured s-process overabundances and C/O ratios with their predicted values. These AGB models have been generated with the STAREVOL code (Siess & Arnould 2008) using an extended s-process reaction network of 411 species and the same input physics as described in Goriely & Siess (2018). The reference solar composition is taken from Asplund et al. (2009) which corresponds to a metallicity Z = 0.0134. To describe the mass-loss rate on the red giant branch (RGB), we use the Reimers (1975) prescription with ηR = 0.4 (in Sect. 7.2, we evaluate the impact of this choice on the derived masses for our sample S stars) from the main sequence up to the beginning of the AGB and then switch to the Vassiliadis & Wood (1993) rate. Dedicated models with an initial mass of 1 M⊙ have been computed for [Fe/H] = − 0.3 and −0.5. In the present calculations, a diffusion equation is used to compute the partial mixing of protons in the C-rich layers at the time of the TDU. Following the formalism in Eq. (9) of Goriely & Siess (2018), the diffusive mixing parameters adopted in our simulations are fover = 0.14, Dmin = 107 cm2 s−1 and p = 1/2, where fover controls the extent of the mixing, Dmin the value of the diffusion coefficient at the innermost boundary of the diffusive region, and p is an additional free parameter describing the shape of the diffusion profile. It should be stressed that a careful study of the parameter space for fover, Dmin, and p has been carried out and only the above-mentioned values have been found to give rise to early TDU episodes and s-process enrichments compatible with observations (see below). While TDU is definitely needed to ensure a proper surface enrichment for the star to become an S star, the diffusive mixing should be strong enough to produce a significant amount of s-elements. On the other hand, the diffusive mixing should not be too efficient, so as to avoid large s-overabundances in the relatively thin envelope of the 1 M⊙ models. More details will be given in a forthcoming paper.
As shown in Fig. 1, the location of our six stars in the HR diagram accurately matches the tracks corresponding to the model star with initial mass 1 M⊙ (the estimated current mass is listed in the last column of Table B.2). It can also be noted (see insert of Fig. 1) that within the error bars on the effective temperatures and luminosities, observations are compatible with the theoretical tracks corresponding to the first three pulse-interpulse cycles of the 1 M⊙ model star. We note that an uncertainty of about 100 K on the model effective temperature should also be considered (Cassisi 2017). The inclusion of efficient diffusive mixing (with a relatively large value of fover) at the bottom of the stellar envelope triggers not only TDU at the end of the first fully developed thermal pulse, but also the mixing of protons into the C-rich layers, hence an s-process nucleosynthesis strong enough to account for the surface enrichment of our six stars. For those with [Fe/H] ≃ − 0.3 (HD 357941 and CSS 154), the measured abundances displayed in Fig. 2 are compatible with the occurrence of three thermal pulses, allowing the star to keep a relatively low C/O ratio (C/O = 0.75, compatible with observations; see Tables B.2 and B.3). Among the lower-metallicity stars which are compared with [Fe/H] = − 0.5 models, CSS 182 and V915 Aql are compatible with a two-pulse enrichment leading to C/O = 0.88. On the contrary, more TDU episodes seem to be required to explain the large surface abundances of s-elements measured in CD −29°5912 and BD +34°1698. However, these many TDU episodes then induce a C/O ratio above unity, which is incompatible with the measured C/O ratios of 0.5 in these two objects.
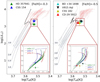 |
Fig. 1. Locations of the low-mass intrinsic S stars (triangles) in the HR diagram, compared with STAREVOL evolutionary tracks of the closest metallicity (as indicated on the top label) and of the labelled masses. In the large panels, the RGB and the core He-burning phases are depicted in grey, whereas the red dashed line corresponds to the AGB tracks. The black dashed line marks the predicted onset of TDU. In the insert, the different colours correspond to different pulse-interpulse cycles of the 1 M⊙ model star, as labelled. |
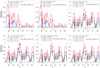 |
Fig. 2. Comparison of the measured abundance profiles with the nucleosynthesis predictions. |
7. Robustness of the derived stellar masses
Here we evaluate the sensitivity of the derived stellar masses on two key factors: (i) the adopted atmospheric parameters (Sect. 7.1), and (ii) the mass-loss rate on the RGB (Sect. 7.2).
7.1. Sensitivity to the adopted atmospheric-parameter set
The somewhat degenerate parameter space of S stars is well illustrated by the comparison of models A and H in Table B.4. For example, a change of Teff by +100 K or −100 K in model A can be compensated by an adjustment of the other stellar parameters (as in model H) in order to yield an equally acceptable fit of the global spectrum. Since the location of the stars in the HR diagram is parameter-dependent, so could, in principle, be the derived masses. The example of CD −29°5912, which is representative of the other stars, shows that this is not the case however (Fig. D.1). Models A and H differ in Teff and C/O, and this difference induces a change in metallicity as derived from the Fe lines ([Fe/H] = − 0.27). However, when compared with evolutionary tracks of the corresponding metallicity, the location in the HR diagram implied by models A or H in both cases falls along the track corresponding to the model with initial mass 1 M⊙.
7.2. Sensitivity to the RGB mass-loss rate
The RGB mass-loss rate has a strong impact on the minimum initial mass for the occurrence of TDUs. Increasing the mass-loss rate by a factor of two along the RGB (in agreement with the typical uncertainty on observed RGB mass-loss rates; see Table 8 of Schröder & Cuntz 2007), we find that a star with initial mass 1.2 M⊙ and ηR = 0.8 will reach the same TP-AGB location in the HR diagram as a 1 M⊙ model with the standard ηR value of 0.4. This simple argument advocates the adoption of an uncertainty of 0.2 M⊙ on the determination of the stellar mass on the basis of its location in the HR diagram, and therefore on the minimum initial mass for the occurrence of TDU.
8. Conclusion
The combination of dedicated MARCS model atmospheres with the Gaia DR2 parallaxes allows us to derive stellar parameters of S stars and to locate them in the HR diagram. Their (initial) masses have been derived as well, comparing these locations with STAREVOL evolutionary tracks. We were able to identify a subsample of six low-mass (1–1.2 M⊙), intrinsic (Tc-rich, Nb-poor) S stars and found evidence for the occurrence of TDU in low-mass AGB stars at relatively low luminosity, that is, at the start of the TP-AGB. Here, we present AGB models that can produce TDUs for initial stellar masses as low as 1 M⊙ and metallicities [Fe/H] of −0.3 and −0.5, provided that a very efficient overshoot with fover = 0.14 is applied at the base of the convective envelope. In the HR diagram, our low-mass intrinsic S stars are nicely located just above the predicted onset of TDU events.
We obtain reasonable agreement between the measured and predicted s-process abundance profiles. However, CD −29°5912 and BD +34°1698 are puzzling since their levels of s-process enrichment require a number of TDU episodes that would bring the C/O ratio well above the measured value. Nevertheless, for the four remaining targets, the agreement between s-process abundances and C/O ratios is satisfactory.
In summary, our results on intrinsic low-mass S stars provide robust evidence that the TDU is active in stars with masses as low as 1–1.2 M⊙ with [Fe/H] in the range −0.3 to −0.5. The new AGB STAREVOL models can now account for the measured s-process abundances of low-mass AGB stars. These new observations and models improve our understanding of the onset of TDU and its mass and metallicity dependence.
The abundance of element X is defined as [X/Y] = log10(nX/nY)* − log10(nX/nY)⊙ where ni is the number density of element i, and Y is a normalising element (usually H or Fe). The exact meaning of [s/Fe] in the grid of S-star MARCS model atmospheres is described in Appendix A.
Acknowledgments
The authors thank the referee for very constructive comments. This research has been funded by the Belgian Science Policy Office under contract BR/143/A2/STARLAB. S.V.E. thanks Fondation ULB for its support. Based on observations obtained with the HERMES spectrograph, which is supported by the Research Foundation – Flanders (FWO), Belgium, the Research Council of KU Leuven, Belgium, the Fonds National de la Recherche Scientifique (F.R.S.-FNRS), Belgium, the Royal Observatory of Belgium, the Observatoire de Genève, Switzerland and the Thüringer Landessternwarte Tautenburg, Germany. This work has made use of data from the European Space Agency (ESA) mission Gaia (https://www.cosmos.esa.int/gaia), processed by the Gaia Data Processing and Analysis Consortium (DPAC, https://www.cosmos.esa.int/web/gaia/dpac/consortium). Funding for the DPAC has been provided by national institutions, in particular the institutions participating in the Gaia Multilateral Agreement. This research has also made use of the SIMBAD database, operated at CDS, Strasbourg, France. LS & SG are senior FNRS research associates.
References
- Alvarez, R., & Plez, B. 1998, A&A, 330, 1109 [NASA ADS] [Google Scholar]
- Arlandini, C., Käppeler, F., Wisshak, K., et al. 1999, ApJ, 525, 886 [NASA ADS] [CrossRef] [Google Scholar]
- Asplund, M., Grevesse, N., Sauval, A. J., & Scott, P. 2009, ARA&A, 47, 481 [NASA ADS] [CrossRef] [Google Scholar]
- Biémont, E., Grevesse, N., Hannaford, P., & Lowe, R. M. 1981, ApJ, 248, 867 [NASA ADS] [CrossRef] [Google Scholar]
- Bisterzo, S., Gallino, R., Straniero, O., Cristallo, S., & Käppeler, F. 2010, MNRAS, 404, 1529 [NASA ADS] [Google Scholar]
- Cassisi, S. 2017, Eur. Phys. J. Web Conf., 160, 04002 [Google Scholar]
- Cayrel, R., Depagne, E., Spite, M., et al. 2004, A&A, 416, 1117 [NASA ADS] [CrossRef] [EDP Sciences] [Google Scholar]
- Corliss, C. H., & Bozman, W. R. 1962, in Experimental Transition Probabilities for Spectral Lines of Seventy Elements; Derived from the NBS Tables of Spectral-line Intensities, (US Government Printing Office), NBS Monograph, 53 [CrossRef] [Google Scholar]
- Cristallo, S., Straniero, O., Piersanti, L., & Gobrecht, D. 2015, ApJS, 219, 40 [NASA ADS] [CrossRef] [Google Scholar]
- Den Hartog, E. A., Lawler, J. E., Sneden, C., & Cowan, J. J. 2003, ApJS, 148, 543 [Google Scholar]
- De Smedt, K., Van Winckel, H., Kamath, D., & Wood, P. R. 2015, A&A, 583, A56 [NASA ADS] [CrossRef] [EDP Sciences] [Google Scholar]
- Duquette, D. W., & Lawler, J. E. 1982, Phys. Rev. A, 26, 330 [NASA ADS] [CrossRef] [Google Scholar]
- Fishlock, C. K., Karakas, A. I., Lugaro, M., & Yong, D. 2014, ApJ, 797, 44 [NASA ADS] [CrossRef] [Google Scholar]
- Gaia Collaboration (Brown, A. G. A., et al.) 2018, A&A, 616, A1 [NASA ADS] [CrossRef] [EDP Sciences] [Google Scholar]
- Gontcharov, G. A. 2012, Astron. Lett., 38, 87 [NASA ADS] [CrossRef] [Google Scholar]
- Goriely, S., & Siess, L. 2018, A&A, 609, A29 [NASA ADS] [CrossRef] [EDP Sciences] [Google Scholar]
- Hannaford, P., & Lowe, R. M. 1985, J. Phys. B At. Mol. Phys., 18, 2365 [NASA ADS] [CrossRef] [Google Scholar]
- Jorissen, A., & Mayor, M. 1988, A&A, 198, 187 [NASA ADS] [Google Scholar]
- Jorissen, A., Frayer, D. T., Johnson, H. R., Mayor, M., & Smith, V. V. 1993, A&A, 271, 463 [NASA ADS] [Google Scholar]
- Karakas, A. I., & Lugaro, M. 2016, ApJ, 825, 26 [NASA ADS] [CrossRef] [Google Scholar]
- Karinkuzhi, D., Van Eck, S., Jorissen, A., et al. 2018, A&A, 618, A32 [NASA ADS] [CrossRef] [EDP Sciences] [Google Scholar]
- Kurucz, R. L. 2007, Robert L. Kurucz On-line Database of Observed and Predicted Atomic Transitions, http://kurucz.harvard.edu/atoms/ [Google Scholar]
- Lugaro, M., Karakas, A. I., Stancliffe, R. J., & Rijs, C. 2012, ApJ, 747, 2 [NASA ADS] [CrossRef] [Google Scholar]
- Martin, G., Fuhr, J., & Wiese, W. 1988, J. Phys. Chem. Ref. Data Suppl., 17 [Google Scholar]
- Mathews, G. J., Takahashi, K., Ward, R. A., & Howard, W. M. 1986, ApJ, 302, 410 [NASA ADS] [CrossRef] [Google Scholar]
- Meggers, W. F., Corliss, C. H., & Scribner, B. F. 1975, Tables of Spectral-lineIntensities. Part I, II - Arranged by Elements (US Government Printing Office) [Google Scholar]
- Merle, T., Jorissen, A., Van Eck, S., Masseron, T., & Van Winckel, H. 2016, A&A, 586, A151 [NASA ADS] [CrossRef] [EDP Sciences] [Google Scholar]
- Merrill, P. W. 1922, ApJ, 56, 457 [NASA ADS] [CrossRef] [Google Scholar]
- Merrill, P. W. 1952, ApJ, 116, 21 [NASA ADS] [CrossRef] [Google Scholar]
- Miles, B. M., & Wiese, W. L. 1969, At. Data, 1, 1 [Google Scholar]
- Nave, G., Johansson, S., Learner, R. C. M., Thorne, A. P., & Brault, J. W. 1994, ApJS, 94, 221 [NASA ADS] [CrossRef] [Google Scholar]
- Neyskens, P., Van Eck, S., Jorissen, A., et al. 2015, Nature, 517, 174 [NASA ADS] [CrossRef] [PubMed] [Google Scholar]
- Nilsson, A. E., Johansson, S., & Kurucz, R. L. 1991, Phys. Scr., 44, 226 [NASA ADS] [CrossRef] [Google Scholar]
- O’Brian, T. R., Wickliffe, M. E., Lawler, J. E., Whaling, W., & Brault, J. W. 1991, J. Opt. Soc. Am. B Opt. Phys., 8, 1185 [NASA ADS] [CrossRef] [Google Scholar]
- Palmeri, P., Quinet, P., Wyart, J., & Biémont, E. 2000, Phys. Scr., 61, 323 [NASA ADS] [CrossRef] [Google Scholar]
- Plez, B. 2012, Astrophysics Source Code Library [record ascl:1205.004] [Google Scholar]
- Raskin, G., van Winckel, H., Hensberge, H., et al. 2011, A&A, 526, A69 [NASA ADS] [CrossRef] [EDP Sciences] [Google Scholar]
- Reimers, D. 1975, Mem. Soc. Roy. Sci. Liège, 8, 369 [Google Scholar]
- Schröder, K.-P., & Cuntz, M. 2007, A&A, 465, 593 [NASA ADS] [CrossRef] [EDP Sciences] [Google Scholar]
- Shetye, S., Van Eck, S., Jorissen, A., et al. 2018, A&A, 620, A148 [NASA ADS] [CrossRef] [EDP Sciences] [Google Scholar]
- Siess, L., & Arnould, M. 2008, A&A, 489, 395 [NASA ADS] [CrossRef] [EDP Sciences] [Google Scholar]
- Smith, V. V., & Lambert, D. L. 1988, ApJ, 333, 219 [NASA ADS] [CrossRef] [Google Scholar]
- Smith, V. V., & Lambert, D. L. 1990, ApJS, 72, 387 [NASA ADS] [CrossRef] [Google Scholar]
- Stancliffe, R. J., Izzard, R. G., & Tout, C. A. 2005, MNRAS, 356, L1 [NASA ADS] [CrossRef] [Google Scholar]
- Stephenson, C. B. 1984, Publ. Warner Swasey Obs., 3, 1 [Google Scholar]
- Straniero, O., Domínguez, I., Cristallo, S., & Gallino, R. 2003, PASA, 20, 389 [NASA ADS] [CrossRef] [Google Scholar]
- van Aarle, E., Van Winckel, H., De Smedt, K., Kamath, D., & Wood, P. R. 2013, A&A, 554, A106 [NASA ADS] [CrossRef] [EDP Sciences] [Google Scholar]
- Van Eck, S., & Jorissen, A. 1999, A&A, 345, 127 [NASA ADS] [Google Scholar]
- Van Eck, S., & Jorissen, A. 2000, A&A, 360, 196 [NASA ADS] [Google Scholar]
- Van Eck, S., Jorissen, A., Udry, S., et al. 2000, A&AS, 145, 51 [NASA ADS] [CrossRef] [EDP Sciences] [Google Scholar]
- Van Eck, S., Neyskens, P., Jorissen, A., et al. 2017, A&A, 601, A10 [NASA ADS] [CrossRef] [EDP Sciences] [Google Scholar]
- Vassiliadis, E., & Wood, P. R. 1993, ApJ, 413, 641 [NASA ADS] [CrossRef] [Google Scholar]
- Wang, X. H., & Chen, P. S. 2002, A&A, 387, 129 [NASA ADS] [CrossRef] [EDP Sciences] [Google Scholar]
- Weiss, A., & Ferguson, J. W. 2009, A&A, 508, 1343 [NASA ADS] [CrossRef] [EDP Sciences] [Google Scholar]
- Wenger, M., Ochsenbein, F., Egret, D., et al. 2000, A&AS, 143, 9 [NASA ADS] [CrossRef] [EDP Sciences] [Google Scholar]
Appendix A: [s/Fe] in the MARCS grid
As a complement to Van Eck et al. (2017), we give here details about the exact meaning of the [s/Fe] parameter in the MARCS grid of S stars, which provides models with [s/Fe] = 0, +1, and +2 dex. This parameter adjusts the abundances log ϵX for elements from Ga to Bi in the following way:
Xs = log10[(nX/nH)⊙×10[Fe/H]×10[s/Fe]×fX, s],
Xr = log10[(nX/nH)⊙×10[Fe/H]×10[r/Fe]×(1−fX, s)],
log ϵX = log10(10Xs + 10Xr).
The fractional s-process abundance of element X (denoted fX, s) is taken from Arlandini et al. (1999). The fractional r-process contribution of that element is then simply given by fX, r = 1 − fX, s. The parameter [r/Fe] is included in the above formulae for the sake of completeness, but it is set to 0 in the S-star grid.
Appendix B: Basic data, atmospheric parameters, and abundances of our sample stars
Basic data of our sample stars.
Atmospheric parameters of the sample stars.
Elemental abundances for the sample stars, along with the standard deviation due to line-to-line scatter.
Sensitivity of the elemental abundances of CD −29°5912 on variations of the atmospheric parameters.
Appendix C: Example spectra
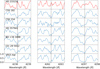 |
Fig. C.1. Spectral region around the three (4238.19, 4262.27 and 4297.06 Å) violet Tc I lines in the sample S stars as well as in a Tc-poor S star from S18 (HD 233158, red curve in the top panels) for the sake of comparison. The spectra have been arbitrarily normalized and binned by a factor of 1.5 to increase the S/N. |
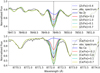 |
Fig. C.2. Illustration of the quality of the match between observed and synthetic spectra obtained for the S star CSS 182 around the Zr I line at 7849.37 Å (upper panel) and the Ce II line at 8772.16 Å (lower panel). |
Appendix D: HR diagram
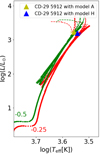 |
Fig. D.1. Location of CD −29°5912 in the HR diagram with parameters of model A (Teff = 3600 K, log g = 1, [Fe/H] = −0.4, C/O = 0.5, [s/Fe] = 1), and model H (Teff = 3500 K, log g = 1, [Fe/H] = −0.27, C/O = 0.9, [s/Fe] = 1) compared with the 1 M⊙ evolutionary tracks of the closest metallicities (labelled with the same colour as the track). |
Appendix E: Linelist
Atomic line list.
All Tables
Elemental abundances for the sample stars, along with the standard deviation due to line-to-line scatter.
Sensitivity of the elemental abundances of CD −29°5912 on variations of the atmospheric parameters.
All Figures
|
Fig. 1. Locations of the low-mass intrinsic S stars (triangles) in the HR diagram, compared with STAREVOL evolutionary tracks of the closest metallicity (as indicated on the top label) and of the labelled masses. In the large panels, the RGB and the core He-burning phases are depicted in grey, whereas the red dashed line corresponds to the AGB tracks. The black dashed line marks the predicted onset of TDU. In the insert, the different colours correspond to different pulse-interpulse cycles of the 1 M⊙ model star, as labelled. |
| In the text | |
|
Fig. 2. Comparison of the measured abundance profiles with the nucleosynthesis predictions. |
| In the text | |
|
Fig. C.1. Spectral region around the three (4238.19, 4262.27 and 4297.06 Å) violet Tc I lines in the sample S stars as well as in a Tc-poor S star from S18 (HD 233158, red curve in the top panels) for the sake of comparison. The spectra have been arbitrarily normalized and binned by a factor of 1.5 to increase the S/N. |
| In the text | |
|
Fig. C.2. Illustration of the quality of the match between observed and synthetic spectra obtained for the S star CSS 182 around the Zr I line at 7849.37 Å (upper panel) and the Ce II line at 8772.16 Å (lower panel). |
| In the text | |
|
Fig. D.1. Location of CD −29°5912 in the HR diagram with parameters of model A (Teff = 3600 K, log g = 1, [Fe/H] = −0.4, C/O = 0.5, [s/Fe] = 1), and model H (Teff = 3500 K, log g = 1, [Fe/H] = −0.27, C/O = 0.9, [s/Fe] = 1) compared with the 1 M⊙ evolutionary tracks of the closest metallicities (labelled with the same colour as the track). |
| In the text | |
Current usage metrics show cumulative count of Article Views (full-text article views including HTML views, PDF and ePub downloads, according to the available data) and Abstracts Views on Vision4Press platform.
Data correspond to usage on the plateform after 2015. The current usage metrics is available 48-96 hours after online publication and is updated daily on week days.
Initial download of the metrics may take a while.