Fig. 1.
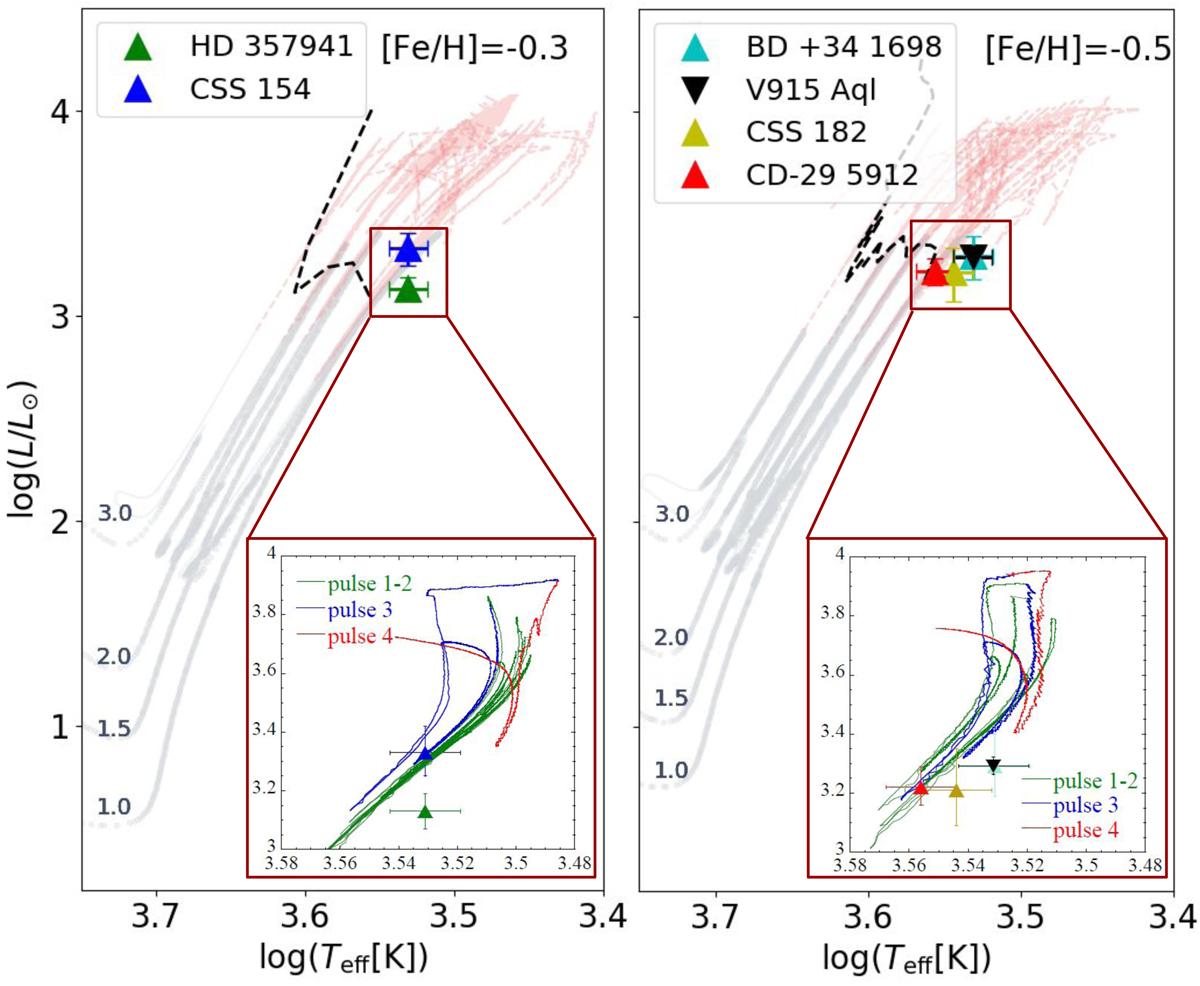
Locations of the low-mass intrinsic S stars (triangles) in the HR diagram, compared with STAREVOL evolutionary tracks of the closest metallicity (as indicated on the top label) and of the labelled masses. In the large panels, the RGB and the core He-burning phases are depicted in grey, whereas the red dashed line corresponds to the AGB tracks. The black dashed line marks the predicted onset of TDU. In the insert, the different colours correspond to different pulse-interpulse cycles of the 1 M⊙ model star, as labelled.
Current usage metrics show cumulative count of Article Views (full-text article views including HTML views, PDF and ePub downloads, according to the available data) and Abstracts Views on Vision4Press platform.
Data correspond to usage on the plateform after 2015. The current usage metrics is available 48-96 hours after online publication and is updated daily on week days.
Initial download of the metrics may take a while.