Free Access
Fig. C.1.
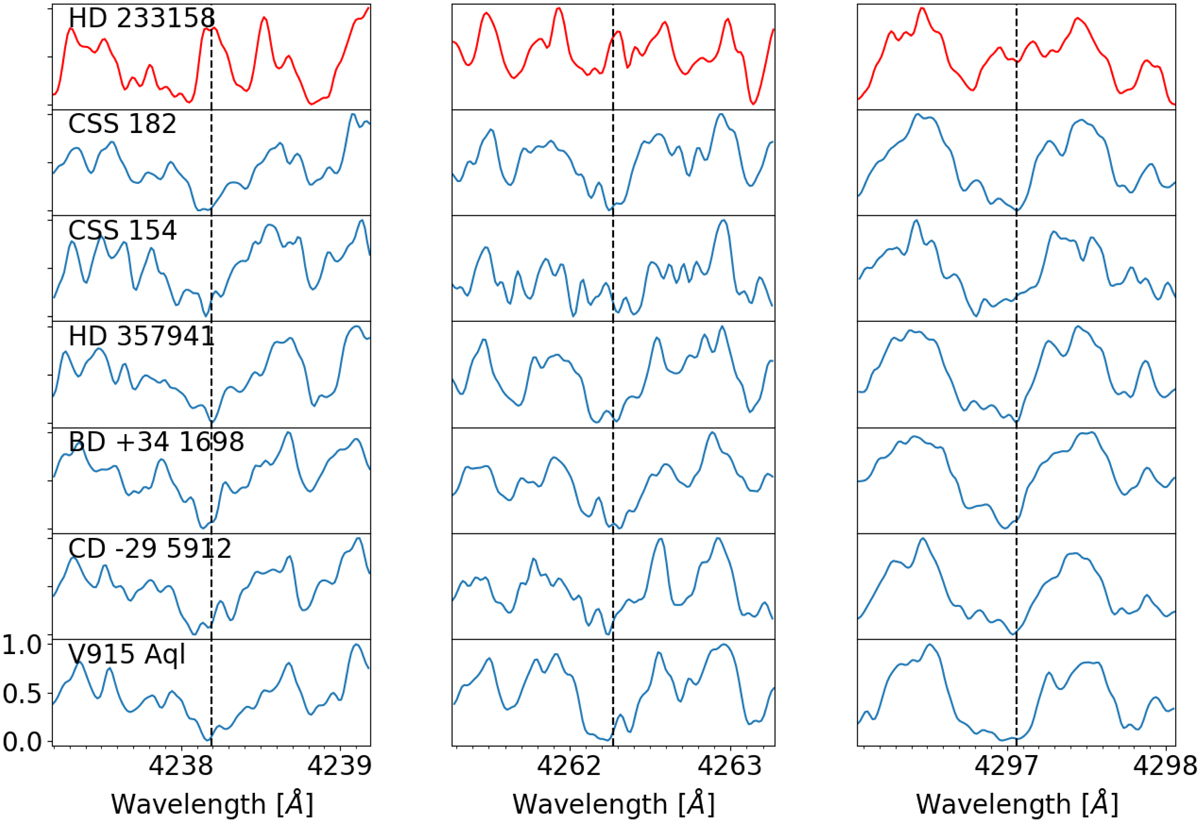
Spectral region around the three (4238.19, 4262.27 and 4297.06 Å) violet Tc I lines in the sample S stars as well as in a Tc-poor S star from S18 (HD 233158, red curve in the top panels) for the sake of comparison. The spectra have been arbitrarily normalized and binned by a factor of 1.5 to increase the S/N.
Current usage metrics show cumulative count of Article Views (full-text article views including HTML views, PDF and ePub downloads, according to the available data) and Abstracts Views on Vision4Press platform.
Data correspond to usage on the plateform after 2015. The current usage metrics is available 48-96 hours after online publication and is updated daily on week days.
Initial download of the metrics may take a while.