Fig. 4.
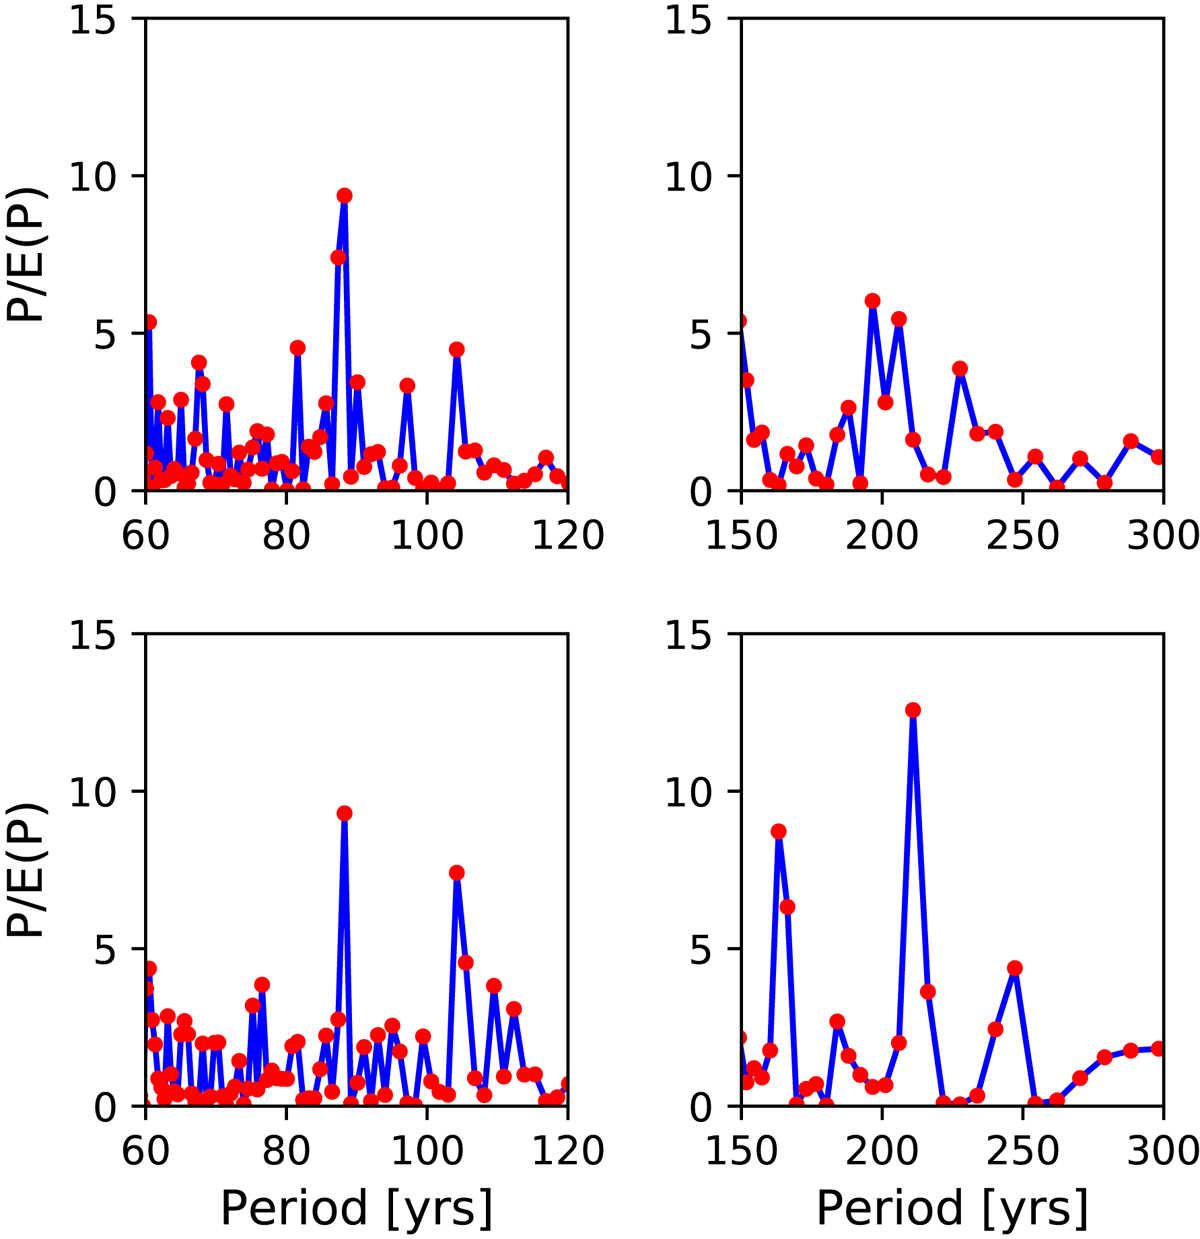
Segments from power spectra around the Gleissberg (left panels) and the de Vries (right panels) periodicities. Shown is the ratio of power to the expectation value (median of 1000 realizations of the NNF model). Spectra from reconstruction based upon cosmic isotopes by (upper panels) are compared with those from selected realizations of the NNF model with 3σ peaks in the same range of periods (lower panels). The red dots emphasize the frequency resolution. The peaks from the empirical data are similarly sharp as those from the model, indicating the random origin of the former.
Current usage metrics show cumulative count of Article Views (full-text article views including HTML views, PDF and ePub downloads, according to the available data) and Abstracts Views on Vision4Press platform.
Data correspond to usage on the plateform after 2015. The current usage metrics is available 48-96 hours after online publication and is updated daily on week days.
Initial download of the metrics may take a while.