Fig. 1.
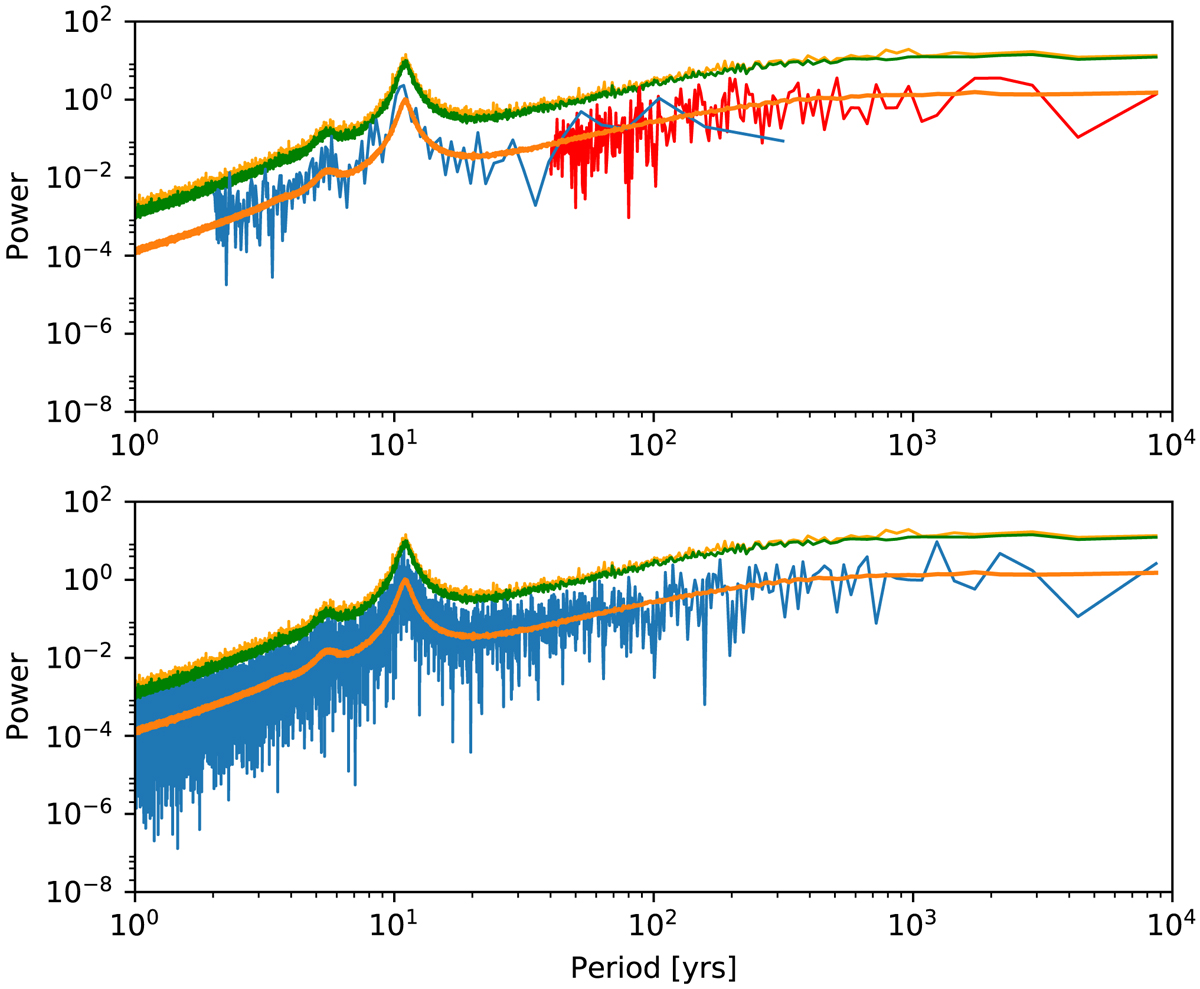
Observed and modeled power spectra of solar activity. Upper panel: spectra based on the historical record of sunspot numbers (blue curve) and on the reconstruction from cosmogenic isotope data (Usoskin et al. 2016, red curve). Lower panel: spectrum obtained from one realization of the noisy normal form model (NNF model Cameron & Schüssler 2017a, blue curve). In both panels, the orange curve gives the median from 1000 realizations of the model, the green curve shows the corresponding 99.865% (3σ) upper percentile, and the yellow curve represents the maximum of the 1000 realizations.
Current usage metrics show cumulative count of Article Views (full-text article views including HTML views, PDF and ePub downloads, according to the available data) and Abstracts Views on Vision4Press platform.
Data correspond to usage on the plateform after 2015. The current usage metrics is available 48-96 hours after online publication and is updated daily on week days.
Initial download of the metrics may take a while.