| Issue |
A&A
Volume 625, May 2019
|
|
|---|---|---|
| Article Number | A94 | |
| Number of page(s) | 23 | |
| Section | Extragalactic astronomy | |
| DOI | https://doi.org/10.1051/0004-6361/201935076 | |
| Published online | 17 May 2019 | |
Young stellar populations in early-type dwarf galaxies
Occurrence, radial extent, and scaling relations⋆
1
Kapteyn Astronomical Institute, University of Groningen, Postbus 800 9700 AV Groningen, The Netherlands
e-mail: This email address is being protected from spambots. You need JavaScript enabled to view it.
2
School of Astronomy, Institute for Research in Fundamental Sciences (IPM), Tehran 19395-5746, Iran
3
Leibniz-Institut für Astrophysik Potsdam, An der Sternwarte 16, 14482 Potsdam, Germany
4
Astronomy Research Unit, University of Oulu, Oulu 90014, Finland
Received:
17
January
2019
Accepted:
28
March
2019
Abstract
Aims. To understand the stellar population content of early-type dwarf galaxies (dEs) and their environmental dependence, we compare the slopes and intrinsic scatter of color–magnitude relations (CMRs) for three nearby clusters, Fornax, Virgo, and Coma. Additionally, we present and compare internal color profiles of these galaxies to identify central blue regions with younger stars.
Methods. We use the imaging of the HST/ACS Fornax cluster in the magnitude range of −18.7 ≤ Mg′ ≤ −16.0 to derive magnitudes, colors, and color profiles, which we compare with literature measurements from the HST/ACS Virgo and Coma Cluster Survey. We take advantage of HST accuracy to investigate and parameterize the (g′−z′) color profiles of these dEs.
Results. Based on analysis of the color profiles, we report on a large number of dEs with young stellar populations at their center in all three clusters. While for Virgo and Coma the number of blue-cored dEs is found to be 85%±2% and 53%±3%, respectively, for Fornax, we find that all galaxies have a blue core. We show that bluer cores reside in fainter dEs, similar to the trend seen in nucleated dEs. We find no correlation between the luminosity of the galaxy and the size of its blue core. Moreover, a comparison of the CMRs of the three clusters shows that the scatter in the CMR of Virgo is considerably larger than in the Fornax and Coma clusters. Presenting adaptive smoothing we show that the galaxies on the blue side of the CMR often show evidence for dust extinction, which strengthens the interpretation that the bluer colors are due to young stellar populations. We also find that outliers on the red side of the CMR are more compact than what is expected for their luminosity. We find several of these red outliers in Virgo, often close to more massive galaxies. No red outlying compact early-types are found in Fornax and Coma in this magnitude range while we find three in the Virgo cluster. We show that the CMR of the Fornax and Virgo clusters are slightly bluer than that of Coma. We suggest that the large number of outliers and larger scatter found for Virgo CMR are a result of the alternative assembly history of this cluster.
Key words: galaxies: clusters: general / galaxies: dwarf / galaxies: photometry / galaxies: star formation / galaxies: evolution / Galaxy: center
The tables of the measured profiles are only available at the CDS via anonymous ftp to cdsarc.u-strasbg.fr (130.79.128.5) or via http://cdsarc.u-strasbg.fr/viz-bin/qcat?J/A+A/625/A94.
© ESO 2019
1. Introduction
Our understanding of galaxy formation and evolution is based on numerical models of the Universe. Parameters in these models are adjusted in order to reproduce a number of observations, such as the galaxy luminosity function, several scaling relations, the appearance of galaxies, the presence of AGNs and so on (for a review, see Silk & Mamon 2012). One of the important scaling relations is the color–magnitude relation (CMR), connecting the magnitude of a galaxy, an indicator of its mass, to its color, an index of its stellar populations. This relation is fundamental, since it tightly connects a macroscopic property, galaxy mass, to small-scale quantities such as the constituting stellar populations. The CMR of the early-type galaxies is often called the “red sequence”, and is very pronounced in observations of galaxy clusters (e.g., Eisenhardt et al. 2007; Stott et al. 2009; Sánchez-Blázquez et al. 2014), and in large surveys such as Sloan Digital Sky Survey (SDSS; e.g., Baldry et al. 2004).
Galaxies were positioned either on the red sequence or the blue cloud, a densely populated area in color–magnitude space where galaxies are found to show star formation. Between the red sequence and the blue cloud, one finds a relatively underpopulated region, called the green valley. The red sequence is known to built up over a relatively long period starting with the most massive galaxies. This process is called downsizing (Thomas et al. 2005; Choi et al. 2014). The red sequence has been identified in (proto) clusters up to z = 2 (e.g., Muzzin et al. 2009; Taylor et al. 2009). Recently, there has been a considerable amount of work going on to understand the faint end of the red sequence, and to find out when dwarf galaxies end up on the red sequence (see Boselli & Gavazzi 2014; Boselli et al. 2014; Roediger et al. 2017; Schombert 2018, for an extended discussion about this).
To better understand the CMR, and therefore one of the influential aspects of galaxy formation, it is important to understand the origin of its scatter. Measuring the scatter is best done in galaxy clusters, since the distance errors are minimized, as all galaxies are roughly at the same distance. Bower et al. (1992) measured a scatter in the relation between MV and both U − V and V − K of ∼0.05–0.06 mag for both the Virgo and Coma cluster, using a sample of giant ellipticals and S0 galaxies. For ellipticals only, the scatter reduces to ∼0.03–0.04 mag by lowering the magnitude range to only 2 mag. For all cases the scatter is larger than the uncertainties in the data. Eisenhardt et al. (2007) found a similar result for the Coma cluster. There is therefore a consensus that the CMR of galaxies is tight, with nonzero intrinsic scatter that cannot be explained by observational uncertainties. It is generally accepted that this scatter is caused by young stellar populations, making the color bluer than expected for a given magnitude (Schweizer & Seitzer 1992). The CMR and its scatter in a galaxy cluster are therefore a very useful tool to measure the evolutionary status of its galaxies.
It is generally known that dwarf galaxies have more extended star formation histories, and move to the red sequence only after their more massive counterparts (Downsizing, e.g., Thomas et al. 2005). For nearby clusters, where the red sequence is well in place for massive galaxies, dwarf galaxies are ideal to study their evolution. However, not many studies discuss the CMR in the mass range of dwarf galaxies, since they have low surface brightness, and wide-field imaging surveys have only recently become available. Janz & Lisker (2009) used SDSS data for early-types of the Virgo cluster and showed that the scatter around the CMR increases toward fainter magnitudes and that the scatter is intrinsic. Roediger et al. (2017) recently showed CMRs in optical colors for the galaxies in the center of the Virgo cluster. Their scatter is significantly lower than the one reported by Janz & Lisker (2009), and they also studied a considerably broader range of magnitudes. The fact that the precision of the magnitudes in both papers is similar for galaxies brighter than Mg = −16 indicates that the decrease in scatter in Roediger et al. (2017) is due to two points: for dwarfs brighter than Mg = −16 the difference in samples seems to dominate (the fact that Roediger et al. 2017 only have galaxies in the center of Virgo), while for fainter objects the SDSS colors are not accurate enough.
In addition to the position of each galaxy on the CMR of its cluster, a detailed study of the color profile of each individual early-type dwarf galaxy (dE) may reveal more information about their formation and evolution. dEs are small, low-luminosity galaxies (MB ≥ −18) (Ferguson & Binggeli 1994) with a shallow potential well that makes them sensitive to their environment. Early studies (e.g., Ferguson & Binggeli 1994) assumed that dEs are gas-free galaxies, however as our understanding of these galaxies improved, it was found that not all the dEs are quiescent galaxies with smooth surface brightness, elliptical isophotes, and regular appearance, since some spiral structure, recent or ongoing star formation, gas, and dust content are reported in some of them (De Looze et al. 2010; Lisker et al. 2006; Grebel 2001; Jerjen et al. 2000; Hodge 1973). Some studies have even reported the detection of H I in some of these galaxies (Conselice et al. 2003; Gavazzi et al. 2003). In addition, Lisker et al. (2006) showed clear signs of star formation in these galaxies by using SDSS spectra. The star formation histories of dEs are diverse and are dependent on environment (e.g., Tolstoy et al. 2009).
The fact that dEs show signs of star formation is not new (Vigroux et al. 1984). Studying young populations in early-type galaxies, Peletier (1993) reported on dust and a recent star forming region in the center of the dE NGC 205 (Messier 110); he presented radial color profiles in various colors and showed that they drop toward the of the galaxy (Fig. 3; Peletier 1993). Durrell (1997) investigated two dEs in Virgo with CFHT and found one of them to have a bluer nucleus than the galaxy. Taking advantage higher-resolution data, Lotz et al. (2004), for a sample of dEs in the Leo Group, the Virgo and Fornax clusters, observed with the Hubble Space Telescope (HST) WFPC2, showed that the nuclei of dEs are bluer than their underlying galaxies. In the Virgo cluster and using SDSS data for galaxies with MB ≤ −13, Lisker et al. (2006) noticed that about 5% of dEs have a blue center. This number is more than 15% among dEs with MB ≤ −15. Pak et al. (2014) found that about 70% of dEs in their Ursa Major sample have a young core with blue UV-optical color, an indication of recent or ongoing star formation in their centers (Gu et al. 2006; De Rijcke et al. 2013).
Studying the formation of stellar populations in the inner parts of dEs could lead us to find some clues about the origin of these galaxies and the role of the environment in their evolution. On the one hand, galaxy properties correlate with their environment. Ram pressure stripping, strangulation, merging, tidal interaction and harassment are among the important processes happening in the cluster and changing the properties of the galaxies. Boselli & Gavazzi (2014) explained that the strong gravitational potential well in the core of these galaxies might keep the gas needed for recent star formation in the stripped galaxies and make the center blue. Recently, Zabel et al. (2019) as part of the Atacama Large Millimeter Array (ALMA) Fornax Cluster Survey, studied the CO(1-0) line as the cold molecular gas tracer which shows star formation. These latter authors reported disturbed morphologies and kinematics for several of their CO detected galaxies. Ram pressure stripping is considered the most probable cause of these disturbed morphologies, which shows the role of clustal environment in their evolution. One of the most popular formation scenarios entails infalling late-type galaxies that interact with the cluster environment and transform to blue-cored dEs (Boselli et al. 2008; De Rijcke et al. 2010; Lisker et al. 2006; Mastropietro et al. 2005). In some other scenarios, gas-rich irregulars are thought to have merged and formed dEs. Pak et al. (2014) suggested that the blue-cored dEs could be a possible object in transition of a late-type galaxy to a red early-type. On the other hand, considering similarities between the Virgo and Fornax nuclei versus their different environment, Turner et al. (2012) concluded that the formation of blue-cored dEs is more dependent local factors of the galaxies than on their residing environment.
Taking advantage of the high-resolution imaging of HST, an object as small as a nucleus of a dwarf galaxy can be distinguished in the nearby clusters further than our local group. Since the size of these blue cores is comparable with the nuclei found by the HST survey of the nearby clusters, reviewing the results of this latter survey could help our investigation. Lotz et al. (2004) used F555W and F814W bands and studied nuclei and globular clusters of 69 dwarf ellipticals in the Virgo and Fornax Clusters and the Leo Group. Defining the nucleus as a bright compact object in the region of 1.5″ from isophotal center, these latter authors noted that most of the nuclei are bluer than their host galaxies. They did not find any correlation between the projected distance from the center of the cluster and the properties of the nuclei and claimed that brighter dEs have deeper potentials and are able to attract gas into their centers, which can explain the reason why redder and brighter dEs have redder and more luminous nuclei. Comparing the nuclei of dEs in Fornax and Virgo, Lotz et al. (2004) could not find any considerable differences.
There are more studies which used HST images to go down to the size of the nuclei. Following the Advanced Camera for Surveys (ACS) Virgo cluster survey, Côté et al. (2006) investigated size, color, and some other properties of the nuclei of dEs in the Virgo cluster using F475W and F850LP bands. These latter authors concluded that the number of galaxies with a bluer nucleus in their sample is between 66% and 82%. They found many more nucleated dEs than previous studies and came to the conclusion that since the color and the luminosity of the nuclei are strongly correlated and rarely relate to their host galaxies, the formation and enrichment of galaxies are more closely linked to internal factors.
The nuclei of the early-types in the Fornax cluster have also been studied using HST resolution. As part of the ACSFCS collaboration, Turner et al. (2012) found that most low- and intermediate-luminosity early-type galaxies in their sample show excess light in their central part. Similar to the previous studies, they also confirm that the nuclei are mostly bluer than their host galaxies, or at least 72% of them, and bluer hosts have bluer nuclei and vice-versa. Comparing their sample with Côté et al. (2006), they concluded that the similarities of the nuclei of these two clusters is an argument showing that the environment does not play a role in their formation and evolution.
Our aim in this paper is to perform a detailed study and comparison of the color of dEs in the magnitude range of −18.7 ≤ Mg′ ≤ −16.0, that is, the range of the dwarfs in ACSFCS, in three nearby clusters: Virgo, Fornax, and Coma. To do this, we chose a sample of very accurate archival HST imaging data. We make a direct comparison between the HST-derived CMRs in these three clusters and study the origin of the scatter and outliers in CMRs. Furthermore, we can relate the position of a galaxy on the CMR with features in its image, such as the presence of dust, young stars, or galaxy truncations. We also study the detailed color of each dE through its color profile and especially concentrate on the very inner part. Since the cores of the galaxies still contain information about the violent processes that have taken place in their central regions, studying them will shed light on our understanding of the formation and evolution of dEs. Here, we aim to determine the radial gradient in the old population (seen in the outer part) as well as the central young population.
Ground-based telescopes in general cannot go further inwards than 1″, which is about 100 pc at the distance of Fornax. Distinguishing the core of a dE in nearby clusters (as small as a few tens of pc) is rarely possible with the sharpest ground-based telescopes (Grant et al. 2005). The ACS camera on HST makes it possible to resolve a small nucleus with  (Côté et al. 2006). Taking advantage of the resolution of HST and the sufficient separation in wavelength of the F475W and F850LP HST bands to study young stellar populations, we can now investigate in more detail the color of the very inner part of dEs in nearby clusters. To discuss the effect of the cluster environment, we choose three clusters with distinct characteristics, all of which have been studied by HST: Virgo, Fornax, and Coma.
The outline of this paper is as follows. In Sect. 2, we present the selected sample of dEs from the Fornax, Virgo, and Coma clusters. The analysis of photometric images of our sample is covered in Sect. 3. The results of the analysis contain various photometric parameters, CMRs, and a color profile of the galaxies in the samples. A comparison of the parameters in these three clusters is given in Sect. 4. Section 5 discusses and summarizes the results. More tables and outcome plots can be found in the Appendix.
2. Sample selection and data
We selected three clusters for which high-quality the HST ACS data is available. For Fornax we obtained archival data from HST Mikulski archive. The list of galaxies is chosen from the ACS Fornax Cluster Survey (ACSFCS; Jordán et al. 2007a). The ACSFCS contains a magnitude-limited sample of 43 galaxies in the Fornax cluster selected from the Fornax Cluster catalog (FCC; Ferguson 1989) and observed with the ACS on HST. The field of view is about 202″ × 202″ and the pixel scale is 0.049″.
Here we included all the early-type dwarf galaxies in the sample of Jordán et al. (2007a). The magnitude limits are given by commonly accepted upper limits for dwarf galaxies (MB = −18; Binggeli et al. 1985) and lower magnitude limits of the Fornax ACSFCS sample. Using the distance modulus of m-M=31.50 of the Fornax Cluster (Table 1), these limits correspond to 13.5 ≤ mB ≤ 15.5. After calculating g′-band magnitudes on the ACS images, and using the same distance modulus, we found that the galaxies have magnitudes between Mg′ = −16.0 and −18.7. This sample selection leads to 26 dEs, for which we used their images in the F475W and F850LP bands. These two bands are similar to the SDSS g′ and z′ bands (Sirianni et al. 2005). We therefore used the magnitude limit −18.7 ≤ Mg′ ≤ −16.0 to select corresponding objects from Virgo and Coma.
Parameters of the three clusters.
For the Virgo cluster, we used HST Mikulski archival data. We selected our sample from the ACS Virgo Cluster Survey (ACSVCS; Côté et al. 2004), which observed 100 dEs in the Virgo cluster. They chose their sample from Virgo Cluster Catalog (VCC; Binggeli et al. 1987) and considered the early-type galaxy classification in Sandage & Binggeli (1984) and some other conditions. We limited the selection to the same magnitude range as above for Fornax which provides us with 55 dwarf galaxies.
For the Coma cluster, we used the Coma ACS Survey (Carter et al. 2008), for which the photometry is described in Hammer et al. (2010). Since the sample of Hammer et al. (2010) consists of all types of galaxies in the fields of the Coma survey, including the nonmembers, we extracted the early-type members by cross-matching their sample with that of den Brok et al. (2011) whose sample of early-type galaxies are spectroscopically confirmed members as well as objects selected by eye as possible members. The same magnitude range as that used by Fornax and Virgo limits this sample to 40 early-type galaxies. The two filters used for the Coma HST observations were F475W and F814W. The transformation between the colors, (F475W–F814W) to (F475W–F850LP), is discussed in Sect. 4.1.
Our final sample consists of bright dEs in the magnitude range of −18.7 ≤ Mg′ ≤ −16.0 (M⋆ ∼ 109 − 1010 M⊙) observed in g′ and z′ by the ACS on HST. The total numbers of the selected galaxies are 26, 54, and 40 in the Fornax, Virgo, and Coma clusters, respectively. One should note that in the Fornax and Virgo clusters, HST was pointed at individually selected galaxies, while in Coma, only a limited part of the cluster was observed, mostly in the central regions. This difference however does not make the samples incompatible, since both samples are still complete in this magnitude range. Although one should consider the Coma sample not as a sample representing the entire cluster, but mostly the cluster center. This should not be a problem, since Coma is used as a comparison cluster containing mostly old galaxies; furthermore, the way it is included now means that the fraction of old galaxies is probably even larger. In Fig. 1 we present the radial distances of each object normalized by the Virial radius of its cluster (Table 1). This figure represents how the selected dEs are distributed in each cluster. The spatial resolution of the observations (corresponding to 1 pixel) is 5, 4, and 24 parsec in Fornax, Virgo, and Coma, respectively.
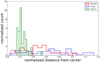 |
Fig. 1. Histogram of the projected distance from the center normalized to the Virial radius of the cluster. Different colors are used for each cluster. |
3. Analysis
3.1. Colors and magnitudes of bright early-type dwarfs
To calculate the color and magnitude of each galaxy in the Fornax cluster, we used Galphot, which is a surface photometry tool (Franx et al. 1989; Jorgensen et al. 1992). We modeled the galaxy in the F475W and F850LP filters with an initial run of Galphot on the inner isophotes with varying parameters such as center, ellipticity, and position angle as a function of radius. We then performed the second run for each band by fixing these variables to the output values of the first run in the F850LP band. The final output is the surface-brightness profile of each galaxy in each band. Before running Galphot, the background of each image was calculated and subtracted using the mean of ten 4 × 4 (pixels square) boxes chosen randomly in the area around the masked galaxy, where we assumed that the contribution of the galaxy was minimal. We then slightly adjusted the background value, requiring the radial intensity growth curve to converge to a finite value. In this way, model-independent effective radii and total magnitudes were determined.
The g′−z′ (equal to F475W–F850LP) color is calculated in the AB photometric system. The zero points in g′ and z′ bands are from Sirianni et al. (2005). The color is determined in the range of 1″ < r < Re to avoid background errors from becoming too dominant, and in most cases, to avoid the nuclear star clusters (for further information on nuclear clusters in Fornax from these data, see e.g. Turner et al. 2012). Table 2 lists our determined parameter values of the bright dEs in Fornax: FCC numbers, g′−z′ colors and their uncertainty, total absolute magnitudes, and effective radii in g′ and z′ bands. The average error in the color is 0.01 mag which combines background uncertainties in each band and zero point uncertainties.
Determined parameters of the dEs in Fornax.
Blakeslee et al. (2009) calculated g − z colors of Fornax early-type galaxies from the ACS HST data as well; they measured colors using annuli up to where the surface brightness of the galaxy is at least 60% of the sky level, whereas we consider the color up to one effective radius. These authors also excluded the innermost annuli r < 1″. Figure 2 shows the comparison of our calculated color versus Blakeslee et al. (2009). FCC26 and FCC90 are two very blue galaxies in our measurements. These galaxies have very extended blue cores; discussed later, in Fig. 8. The fact that the apertures used by Blakeslee et al. (2009) are larger could explain this difference.
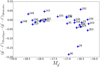 |
Fig. 2. Difference between tabulated (g′−z′) colors in Table 2 and calculated colors in Blakeslee et al. (2009) for Fornax vs. g′-band magnitude. The two outliers, FCC90 and FCC26, have very blue extended cores in Fig. 8. |
To check the accuracy of the effective radii, we show the ratio of the radii in g′- and z′-bands as a function of galaxy magnitude in Fig. 3. Since FCC26 and FCC90 have very blue centers, which is further discussed in Sect. 4.3,  is larger than 1. Most of the galaxies however show a ratio in the range of 0.8–1, implying a larger effective radius in the g′-band. These galaxies generally become bluer going outwards, that is, a negative color gradient which is discussed in detail in Sect. 4.5. This range of ratios is not unexpected (see e.g., Table 3 of Peletier et al. 1994, for ratios between effective radii in B and R in more massive galaxies). We also compared our determined effective radii in the g′ band with those of Ferguson (1989) in the B-band in Fig. 4.
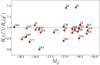 |
Fig. 3. Ratio of effective radii in g′- and z′-bands vs. absolute magnitude in g′-band. The dashed line is |

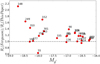 |
Fig. 4. Ratio of effective radii of Ferguson (1989) to the effective radii in g′-band in this paper vs. total magnitude of the galaxy in g′-band. The dashed line is Re(Ferguson)=Re(new). |
For the Virgo cluster, we adopt the colors from Ferrarese et al. (2006); they determined them in the same radial range as we described for Fornax above (1″ < r < Re). The photometric errors in Virgo given by Ferrarese et al. (2006) are much larger than what we derived here, since they gave errors on the total colors. However, inside Re the surface brightness of the galaxies is generally so high that the errors in the magnitudes inside Re are almost exclusively caused by errors in Re. When one determines the errors in the color inside Re, they almost completely vanish because the dependence on Re vanishes. By concentrating on colors, we avoided the large (often 0.1 mag or larger) magnitude errors quoted in Ferrarese et al. (2006). Instead, for errors of the colors in Virgo, we used the average error of the early-type dwarfs in Fornax.
For the Coma cluster, the colors are tabulated by Hammer et al. (2010) from the HST/ACS data. As the closest magnitude system to ours in that paper is the Kron magnitudes, we used colors calculated in Kron aperture (1 Kron radius corresponds to 1.19 effective radius for an exponential surface brightness profile). For all three clusters, the photometry was corrected for Galactic extinction using the dust maps of Schlegel et al. (1998) with the extinction law adopted by Jordán et al. (2004; ACSVCS-II) from Sirianni et al. (2005):
 (1)
(1)
 (2)
(2)
For Fornax and Coma we used the same foreground extinction for the galaxies in each cluster, ⟨E(B − V)⟩ = 0.013 and ⟨E(B − V)⟩ = 0.009, as is reported in Jordán et al. (2007a) and Hammer et al. (2010). For Virgo we used different correction values for each galaxy tabulated in Ferrarese et al. (2006) with a mean E(B − V) value of 0.028.
3.2. Color profile, unsharp masking, and color maps
To accurately investigate the substructure in the stellar populations of each galaxy, radial color profiles were determined. This process was done for the Fornax and Virgo galaxies, while for the Coma cluster we simply adopted the output of Galphot from den Brok et al. (2011) who did the same procedure as above to calculate the color profiles. All the color profiles are sky subtracted. It is important to mention that the color obtained in the centers of the galaxies, which this paper is interested in, is very sensitive to the point spread function (PSF) of the data. We convolved the image of the galaxy in each band with the PSF of the other band before running Galphot on them, in the same way as was done in Peletier et al. (2012), for example. The PSFs used here are generated by the Tiny Tim HST PSF software (Krist et al. 2011).
The unsharp masking technique is a well-known method to study the substructure of a galaxy. An unsharp mask is the original image divided by the smoothed one. This method amplifies high-frequency components of the image which provides a more reliable and clear detection of gas, dust features, and asymmetric star formation regions compared to the residual image (Lisker et al. 2006). We produce unsharp masked images of the Fornax galaxies by smoothing them with a two-dimensional circular Gaussian of a kernel size of σ = 20 pixels (1 arcsec). In most cases the unsharp masked images show central irregularities which are caused by gas and dust features or regions of young stellar populations.
Another method for extracting substructures involves identifying them on a color map of the galaxy, which is made using the images of the galaxy in two different filters. In Fig. 8, we present the unsharp masked and color maps of our Fornax sample.
4. Results
4.1. The color–magnitude relation
To compare the CMRs of these three clusters, we converted the Coma F814W data to the F850LP system using the following transformation, which is derived from Formula 1 in the Appendix of Roediger et al. (2017) :
 (3)
(3)
The resulting (F475W–F850LP) color corresponds to the SDSS g′−z′ color, with possible minor differences due to small differences in filter transmission curves.
Figure 5 shows the color–magnitude diagram (CMD) for the Virgo, Fornax, and Coma clusters. In the upper panel, we show the data points as well as three different least-squares fits to dEs of each cluster, taking into account the uncertainties in the photometry. In the lower panel we fit the CMR of the two other clusters with the slope fixed to the slope of the CMR of the Coma cluster. The parameters of these fits are given in Table 3. We applied an iterative sigma-rejection algorithm (σ = 3) to all three clusters before fitting the lines in both upper and lower panels, removing the bluest outliers.
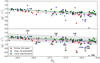 |
Fig. 5. Color–magnitude diagram of bright dEs from Fornax (this study), Virgo (Ferrarese et al. 2006), and Coma (Hammer et al. 2010). The color codes of least-squares fitted lines are the same as for the points; red for Fornax, blue for Virgo, and green for the Coma cluster. The fitted lines in the upper panel are least-squares fits for each cluster. In the lower panel we fixed the slope of the fitted lines to the slope of the CMR in Coma as determined in the upper panel. All the parameters of the lines are given in Table 3. The VCC and FCC numbers of the red and blue outliers in the Virgo and Fornax clusters are indicated. The gray area shows the area of ±2σ away from the CMR of Coma. The colors and magnitudes have been corrected for galactic extinction. |
The bottom panel of Fig. 5 shows that Fornax and Virgo are bluer than Coma. The second result is that the scatter with respect to the CMR is higher for the Virgo cluster. The standard deviations, σ, of the fitted lines to the Fornax, Virgo, and Coma are σ = 0.060, 0.144, 0.065 mag, respectively, after 3σ clipping. We discuss the interpretation of these results in the following section.
4.2. Reasons for the scatter in CMR
Considering the cluster masses (Table 1) and the morphology–density relation, one might expect the scatter in Coma to be the smallest, given the fact that the Coma galaxies were mostly selected from the center of the cluster, followed by Virgo and then by Fornax. Since galaxy formation would go faster in the most massive clusters (downsizing), the scatter caused by residual star formation should become smaller as clusters get more massive. However, in the previous section the scatter in Virgo was shown to be much higher than in Coma and Fornax.
Figure 6 shows a histogram of color residuals with respect to the CMR of Coma. For this we assumed that the CMR is a relation connecting the oldest galaxies for all magnitudes. A galaxy may lie blueward of the CMR when it has a younger effective age. In principle, a galaxy cannot lie on the red side of the CMR of early-types. We assumed that the CMR of Coma, as it is the reddest and the one with the least scatter, indicates this relation with the oldest galaxies. In this case, the color residual is a measure of the age difference between the oldest galaxy at a certain magnitude and the galaxy itself. To find outliers from the CMR we fitted a normal distribution on the color residuals of all three clusters together. Before fitting that, we clipped all the galaxies further than 3σ. After clipping, the Gaussian distribution has σ = 0.09. Here we defined red and blue outliers as galaxies that are located further than 2σ on both sides of the CMR; this area is shown in gray in the lower panel of Fig. 5. Fornax has only blue outliers: FCC 26, FCC 90, and FCC 152. Virgo has some outliers on both blue and red sides: VCC21, VCC1192, VCC1261, VCC1488, VCC1499, VCC1695, VCC1779, and VCC1857 are on the blue side and VCC1327, VCC1297, and VCC1192 are on the red side. Coma has one bluer outlier: COMAi13005.684p275535.20. The names of these outliers are shown in the lower panel of Fig. 5.
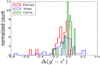 |
Fig. 6. Distribution of the difference between the color of a galaxy in our sample and its expected color from the CMR of the Coma in Fig. 5. |
Investigating the behavior of the outliers in Fig. 7, we found that the effective radii and the colors of the outliers are strongly correlated. This figure was made by determining the color and the radius that an average galaxy of a certain magnitude should have, using the color–magnitude and magnitude–effective radius relation of the sample. A least-squares fit gave us the following relation between g′-band magnitude and effective radius for Fornax, Virgo, and Coma clusters, respectively:
 (4)
(4)
 (5)
(5)
 (6)
(6)
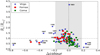 |
Fig. 7. Δcolor vs. normalized effective radius in g′ for the bright dEs in Fornax, Virgo, and Coma. Δcolor is the difference between the color of a galaxy in our sample and its expected color from the CMR of the Coma cluster (color residual). Here the effective radius is divided by the expected radius from Re vs. magnitude relations in each cluster: Eqs. (4), (5), and (6). The vertical dashed line corresponds to the CMR of Coma and the horizontal dashed line is Re = Rref. The gray area corresponds to the gray area of Fig. 5. |
The effective radii of the galaxies in Coma are extracted from the HST Coma survey Paper III (Hoyos et al. 2011). Δcolor is the difference between the color of a galaxy from the CMR of the Coma cluster. We defined the normalized effective radius as the ratio of the effective radius in g′ and the expected radius from the radius-magnitude relation. Plotting Δcolor versus normalized effective radius, we found that there are three regions in Fig. 7: the galaxies with small Δcolors and normal radii, the ones that are redder than the CMR, which tend to have smaller radii than expected, and the ones that are bluer, which mostly tend to be smaller in size. The second group can be identified with the class of compact (red) dwarf ellipticals, while the third are dwarf ellipticals with young stellar populations, which are also more compact, as in for example BCD galaxies. We note that the second group (of compact dwarf ellipticals) does not contain any galaxies in Fornax and Coma, but several objects in Virgo. Apart from some exceptions, there is a visible trend that as galaxies become redder they also become smaller. VCC1661 is the galaxy with the largest effective radius (for a detailed study of this extended galaxy see Koch et al. 2017).
We first discuss the red outliers in detail. They are generally compact elliptical galaxies. These are objects like M32, with radii smaller than expected, and redder colors; they tend to be red, without any strong sign of young stellar populations (Guérou et al. 2015; Chilingarian et al. 2009). It is thought that these objects lost a significant amount of matter and light in an interaction, causing a truncated surface-brightness profile. The resulting color after the interaction is redder than expected for its radius, since the original galaxy was larger and therefore had a redder color. Furthermore, the central regions are generally redder, due to the color gradients in the original galaxies surviving the interaction.
To understand the outliers on the red side better, we take a closer look at them. All of the following outliers are Virgo early-type dwarfs: VCC 1192, VCC 1297, and VCC 1327. There are two additional red galaxies very close to the 2σ threshold from Virgo: VCC 1627 and VCC1871. From Ferrarese et al. (2006), VCC 1192 is a close companion of the massive elliptical, M49, with a projected distance of  . Similarly, VCC 1297 and VCC 1327 are at the projected distances of
  and
and  from M87. All three galaxies are near giant companions and could be tidally truncated by interactions with their massive neighbors. Interestingly, Guérou et al. (2015) classified VCC 1192 and VCC1297 as compact early-type galaxies. It looks as if most, and perhaps all, of the red outliers are compact dwarfs. In Guérou et al. (2015) there are more compact galaxies from Virgo that are slightly redder or are on the CMR in our plot: VCC1178, VCC1440, VCC147, and VCC1627; although they are not counted as red outliers here as they are in the 2σ shaded area. To conclude, we found three outlying red galaxies in the Virgo cluster more than 2σ away from the CMR of Coma.
On the blue side of the CMR, there are also several outliers that have been discussed extensively in the literature; by for example Lisker et al. (2007). These are objects that still contain a considerable fraction of young stellar populations, even though they have been classified as dEs. In Fig. 8, we show the unsharp masked images of these galaxies from the Fornax cluster. It is clear from their unsharp masked images that they have extended star forming regions. FCC26 and FCC90 are both also bright in GALEX UV, indicating young stars (Gil de Paz et al. 2007). Dwarfs with younger stellar populations lie on the blue side of the CMR in most cases. In addition, VCC1499 is highlighted by Boselli & Gavazzi (2014) as an example of a galaxy with a “post-star-burst” spectrum.
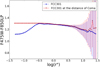 |
Fig. 8. Color profiles (color-log(r)) and unsharp masked and color images of the Fornax early-type dwarf galaxies. In the color profiles, the green line shows the color of the CMR in that magnitude. The red line is fitted to the outer part of the profile and the black dashed line separates the inner part from the outer part of the galaxy. The width of the unsharp masked and the color images is 26″ and the color of the unsharp masked image is inverted. |
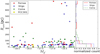 |
Fig. 8. continued. |
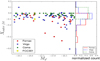 |
Fig. 8. continued. |
Since the colors provide us with crude information about the galaxy ages, we can estimate the age difference between galaxies in the clusters by assuming that galaxies consist of a single stellar population. For a typical dE metallicity, Z = 0.004 (Ryś et al. 2015), the models of Bruzual & Charlot (2003) predict Δ(g′−z′)/Δ(logAge)=0.575. An offset of Δ(g′−z′) = 0.102 (Table 3) for Fornax regarding the Coma CMR corresponds to a difference in age of about 1.5 Gyr. On average, the early-type dwarfs in the center of Coma are therefore 1.5 Gyr older than the ones in the Fornax and Virgo clusters.
We applied a Kolmogorov–Smirnov (K–S) test to investigate whether age distributions of the three clusters are similar within the errors; we compared two clusters each time. The outcome probabilities, p-value, indicate whether or not these ages are drawn from the same distribution: p = 0.032, 0.0001 and 0.008, respectively, for (Fornax, Virgo), (Fornax, Coma) and (Virgo, Coma) pairs. These tests indicate that the age distribution of dEs in Coma is statistically different from the age distributions of dEs in Fornax and Virgo; the latter two have more similar age distributions.
4.3. Radial color profiles
The color profiles of 26 early-type dwarf galaxies in the Fornax cluster are shown in Fig. 8. In these profiles, the color is (F475W–F850LP) in AB-mag. The radius (r) is the circularized distance of each fitted ellipse,  , where a and b are semi-major and semi-minor axes of the ellipse. We fitted a color-log(r) line to the color of the outer part of the galaxy shown by the red line in the color profiles of Fig. 8. This line fits better to the outer parts of the color profiles, similar to the way explained by den Brok et al. (2011). We used an error-weighted least-squares method to fit these lines. For each color profile, the red fitted lines are extrapolated inward. We started our color profiles at 1 pixel equal to 0.05″ and continued in radius as far as 0.8 Re. The effective radii and total magnitudes in g′ are from Table 2.
For most dEs in the Fornax cluster sample, the color profiles are getting slightly bluer going outward. den Brok et al. (2011) and also Peletier et al. (2012) interpreted the outer bluing as an effect of old stellar populations for which the metallicity is slowly decreasing outward. The green line in Fig. 8 shows the color this galaxy would have if it were exactly on the CMR of Fornax (Table 3). In the center of the galaxies, the profile drops down making a blue central region. The black vertical lines show the starting point of the core inside which the color profile does not follow the slope of the outer part. These points were chosen by eye. den Brok et al. (2011) defined it as the center which has been excluded in their color gradient calculation to have a better-fitted line to the outer part of a galaxy. In some cases, the color profiles do not follow this shape and they have a very extended bluer area; for example, FCC 26, FCC 90, and FCC 152. For these galaxies, it is clear from their unsharp masked and color images that they contain a large and extended amount of dust and young stellar populations. Since the previous scheme is not appropriate in such cases, we did not fit a line to their profiles.
The unsharp masked and color images of each galaxy are shown in the right-hand side of the corresponding color profile in Fig. 8. The width of their boxes are 26″. Galaxies with extended blue cores, such as FCC26, FCC90, FCC119, FCC152 and FCC335, have young stellar populations and dusty regions in their unsharp masked and color images. According to the color images, some of the galaxies have a very well-defined blue center, that is, FCC148 and FCC204.
To quantize better these color profiles, we determined various parameters. The color gradient, the slope of the fitted red line, is one of the calculated parameters. A positive (negative) color gradient indicates that the galaxy has a redder (bluer) color as it goes outward. Another parameter is the excess light of the core from the fitted line to the outer region. In the color profiles, it is the average of the difference between the color of the center, separated by the black vertical line, and the extrapolated dashed red line:
 (7)
(7)
where IF475W is the intensity in F475W band. This average is calculated between the start point of the radius of the color profile and the dashed black line, that is, the central part of the galaxy. Positive (negative) amounts generally show that the center of the galaxy is redder (bluer) than the fitted line to the outer part. A similar formula is used to find the excess light from the CMR line, the green line in color profiles, for the whole profile, XCMR = ⟨Colorgalaxy − ColorCMR⟩. In this parameter, which we call excess light from the CMR line, a positive (negative) sign implies that the galaxy, in total, is redder (bluer) than the CMR.
Table 4 lists the measured parameters for our sample of the Fornax cluster. For the three galaxies without the fitted red line, we considered the green line to be the reference color of their older population, where we can calculate the excess bluer light of the center from there. In this case, Xouter fit = XCMR. Their core sizes are equal to the end point of the color profile. The color gradient of the fitted line for these extended cases is set to n in the table.
Fornax dEs color profile parameters.
For the Virgo cluster, we applied the same procedure. The color profiles of the dEs in Virgo with the same color-log(r) line fitted to the data are shown in Fig. A.1. The resulting parameters are listed in Table 5, which similar to Table 4. We note that in Table 5, when there is no fitted line to the color profile, as is the case for the galaxies with extended blue centers, the core size, the excess light from the fitted line and the color gradient are as explained in the previous paragraph. For the galaxies without a core, the core size and the excess light from the fitted line are displayed by n in the table.
Virgo dE color profile parameters.
The position of the galaxies on the CMR of the Virgo galaxies is given in Table 3 and is shown by the green horizontal line in the color profiles. For some cases, Côté et al. (2006) noted that the color of their nucleus is quite blue; For VCC21, for example, this is (F475W − F850LP)=0.3, which is consistent with its color profile in Fig. A.1 of this paper. These latter authors interpreted this galaxy as dIrr/dE transition type with a blue nucleus younger than 1 Gyr for any selected metallicity.
The output of the Galphot task in the two different bands for each galaxy from den Brok et al. (2011) is used to re-plot the color profiles to determine the same parameters for our Coma sample. A color-log(r) line is fitted to the color profile of the galaxies in Coma to calculate the excess light in the same way as in Fornax and Virgo. A similar color–magnitude relation is used for the Coma cluster, Table 3. Since the two filters which have been used in den Brok et al. (2011) for Coma cluster are F475W and F814W, we used formula 3 to transform (F475W–F814W) to (F475W–F850LP), in order to be compatible to the colors in our Fornax and Virgo samples. The core size, excess light from the fitted line and from the CMR, and the color gradient are calculated in the same way as in the Fornax and Virgo clusters to make a similar table for Coma; see Table A.1.
4.4. Presence of blue centers in the galaxies
In this paper, we used both the blue core and blue galaxy definitions as follows: if the core of a galaxy, as separated by the black dashed vertical line, is below the red fitted line in its color profile, it has a blue core and when the whole color profile of a galaxy is below the green color–magnitude relation line, it is a blue galaxy. The definition of a blue center in Pak et al. (2014) and Lisker et al. (2007) could be a blue galaxy or just a blue center in our study, since they do not separate the center as we do. In Fig. 8, all galaxies with a fitted line have a blue core, sometimes a very small one, however they are not necessarily blue galaxies. These blue centers are confirmed by aperture photometry and for some of them it is clear in their color and unsharp masked images.
As can be found in the color profiles and the table of the galaxies in Virgo, there are two galaxies with a red center: VCC828 and VCC1695. They most likely have a dusty center or as Ferrarese et al. (2006) mentioned for VCC1695, the spiral structure and dust is visible in their color images. There are some completely blue galaxies for which we did not fit a line, as in the Fornax sample: VCC1049, VCC1488, VCC1499, and VCC1779, and some galaxies that do not have any distinct and distinguishable center: VCC1539, VCC1833, VCC1857, and VCC2050. Apart from the mentioned galaxies, and VCC1327 to which we did not fit a line, 43 out of 54 other galaxies have a blue center. Studying color profiles with SDSS data, Lisker et al. (2006) classified VCC21, VCC1779, VCC1488, and VCC1499 as dEs with blue centers which are also very blue ones in our color profiles of the Virgo galaxies.
In our sample of the Coma cluster, 19 galaxies do not have any detectable core ( ∼ 47%±3%). It could be that because of the distance to Coma a small core exists but it is not detectable, or that these galaxies do not have a core at all. There are no galaxies with a red core in our Coma sample. Finally, 29 out of 42 dEs have a blue center in our sample for this cluster.
4.5. Comparison between the clusters
The three clusters that are used in this study, Fornax, Virgo, and Coma, have distinct characteristics. Comparing Fornax and Virgo with the Coma cluster, one should keep in mind that Fornax and Virgo with distances of 16.5 and 20.0 Mpc (Blakeslee et al. 2009), are almost at the same distance when compared to the Coma cluster, which is at 100 Mpc (Carter et al. 2008). To understand how the distance is affecting our parameters in Coma, we simulated the impact of distance on the Fornax and Virgo images, that is, the effect of putting a galaxy from Fornax or Virgo at the distance of Coma. As an example we chose one galaxy from the Fornax sample: FCC301. This galaxy is convolved with a Gaussian function to see the effect of distance on our method to determine the blue center. The core size of the galaxy is not detectable at the distance of the Coma cluster; see Fig. 9. One should take this into account when comparing the Coma cluster with Fornax and Virgo. We show more results of this convolution in the following figures.
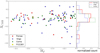 |
Fig. 9. Simulation of the color profile of FCC301 at the distance of Coma in red, together with its original color profile in blue. |
To see the effect of the cluster environment on the calculated parameters, we compared these parameters in the three clusters in Figs. 10, 11, 12, and 13. Here is the description of each plot:
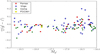 |
Fig. 10. Core size vs. magnitude in the Fornax, Virgo, and Coma clusters. The yellow markers show the change of the core size for FCC301 before and after (marked with an “x” sign) putting it at the distance of Coma. The zero core size could be a nondetectable core or a galaxy without a core. |
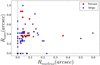 |
Fig. 11. Excess from the fitted red line (Xouter fit) vs. magnitude in the Fornax, Virgo, and Coma clusters. As the yellow makers show for FCC301, the excess light drops to zero after putting it at the distance of Coma (the one at the distance of Coma has a “n” “x” symbol on it). A negative (positive) excess is driven by a bluer (redder) center than the galaxy. The very large core sizes are galaxies with extended blue cores. |
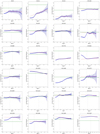 |
Fig. 12. Excess light from the CMR line vs. magnitude in the Fornax, Virgo, and Coma clusters. The yellow point with an “x” symbol on it shows FCC301 before and after it was simulated to be at the distance of Coma. XCMR does not change after convolution. The extreme negative points are galaxies with young stellar populations and the most positive ones are dusty galaxies. |
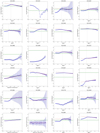 |
Fig. 13. Color gradient vs. magnitude for the Fornax, Virgo, and Coma clusters. The yellow points show FCC301 before and after (with an “x” symbol on it) simulated at the Coma distance. |
-
(A)
Figure 10 shows the size of the blue or red core region in parsec vs. the magnitude of its galaxy and its histogram for the three clusters. The estimated errors of the center sizes are about 20%. A distance of 50 pc corresponds to about 11, 12, and 2 pixels at the distance of Fornax, Virgo, and Coma, respectively. For Fornax and Virgo, most galaxies have a core size between 0 and 50 pc whereas the core sizes in the Coma cluster peak at values between 50 and 100 pc. The yellow diamonds are FCC 301 at its true distance and when simulated to be at the distance of the Coma cluster (marked with am “x” symbol). The core size of the galaxy is smaller at the distance of Coma, and becomes smaller than 50 pc (see Fig. 9). The larger size of the cores in Coma has been noted before (den Brok et al. 2014), although that study noted that it was not clear if this size difference was due to the quality of the data, incomplete knowledge of the PSF, or actual physical differences. We note that the galaxies located at y = 0, the dotted line, are either a galaxy with a small nondetectable core or a galaxy without any specific core. No special trend is obvious in this plot. The galaxies that have very large cores are those with extended blue regions.
-
(B)
Figure 11 shows the equation used to calculate the excess light, Xouterfit, which is explained in Formula 7. The sign of the excess light from the fitted line to the outer part is an indication of the color of the center; a positive sign refers to a red core and a negative one shows a blue core. Most of the galaxies have a negative excess light as a result of their blue core. This plot shows that there is no galaxy with a red center in the Fornax and Coma clusters. In Virgo, there are two galaxies with a red core: VCC828 and VCC1695. The peak of excess light from the fitted line in all of these three clusters is in the range of −0.05 to 0. The excess light of FCC301 becomes zero after moving it to the distance of Coma, as yellow markers show, which is a predictable result due to the distance of this latter cluster. This could explain the smaller excess light of the galaxies in the Coma sample in the same range of magnitude, as the difference between the color of the core and the rest of the galaxy is less distinguishable. In general we see a trend from fainter galaxies with larger and bluer cores to brighter ones with smaller and less blue cores. This result is compatible with Turner et al. (2012) who noted that redder nuclei reside in more luminous hosts in the Fornax cluster and also that most of the cores are bluer than their host galaxies. The galaxies with very large excess are always extended, which is clear in their color profiles in Fig. 8.
-
(C)
The plot in Fig. 12 is the excess light from the CMR, XCMR, of each galaxy versus its magnitude in g′-band. It is comparable to Figs. 5 and 6, although here we can better study the distribution of the galaxies regarding the CMR of each cluster. The Coma sample is more concentrated around zero and has galaxies on both sides. In comparison, Virgo is more diffuse with both redder and bluer galaxies compared to the CMR. We emphasize here that the positive and negative signs represent the red and blue color of the total profile and not just the core. In this plot, very red galaxies are mostly compact ellipticals and very blue ones are star-forming galaxies as discussed in Sect. 4.2. It is important to note that the excess light value after convolution of FCC 301 is unchanged, and so the comparison of the clusters is more reliable in this parameter. It is remarkable that galaxies that are brighter than Mg′ = −17.5 are more concentrated around the CMRs. No clear trend is visible in this plot.
-
(D)
In Fig. 13, the color gradients of Fornax, Virgo, and Coma are plotted. Here the yellow markers show the change from before to after convolution for FCC301. The gradients for most galaxies are negative, although for the faintest galaxies many are also positive. Since the young centers have been removed here, this figure shows just the old stellar populations in the outer part of the galaxies. Virgo and Fornax have more galaxies with positive color gradient, suggesting that the star-forming regions are more extended than the centers. A trend from negative and brighter galaxies to positive and fainter ones can be distinguished here. The Spearman’s rank correlation coefficient for all the galaxies together in this plot is 0.2, which shows a weak correlation. This coefficient is the highest for Fornax 0.49 and is lower for Virgo and Coma, 0.06 and 0.20.
5. Discussion
In this paper, we calculated and tabulated the magnitudes, colors, and effective radii of the bright dEs in the Fornax cluster from high-quality HST observations. We then compared their CMD with similar galaxies in Virgo and Coma. Since the observational errors in the HST data are small, we are able to study the scatter in the CMR in detail and to compare the three clusters. We found that the scatter in the CMR of Virgo is considerably larger than in Fornax and Coma. The scatter is due to the presence of young stars, causing galaxies to lie on the blue side of the CMR, and compact early-type galaxies, which lie on the red side of it. We also found that the CMRs of Fornax and Virgo are somewhat bluer than that of Coma.
In addition to colors, we presented the color profiles of dEs in the Fornax and Virgo clusters and we used the color profiles of den Brok et al. (2011) for the Coma cluster. These clusters were observed using ACS on HST, giving us an opportunity to study the color of the innermost parts of the dEs, which is almost impossible from the ground. We parameterized these radial color profiles to study their differences in the three clusters and to find out how the cluster environment can possibly affect them.
5.1. Outliers and scatter about the CMR
The CMR of the early-type galaxies in nearby clusters and its scatter have been studied for several decades (e.g., Sandage 1972; Sandage & Visvanathan 1978). For massive galaxies, Schweizer & Seitzer (1992) showed that the blueward deviation from the CMR is a morphological indicator of recent mergers. The presence of younger stars, establishing that galaxies evolve towards a tight CMR, which was later called the red sequence (Bell et al. 2004). Our results in Sect. 4.2 confirm the picture of Janz & Lisker (2009) and Roediger et al. (2017) that the CMR of Virgo has nonzero scatter. In this paper we used HST data however, allowing us to study the young stellar populations and the extinction in more detail.
In our sample, all the red outliers are compact galaxies and the projected locations of most of them are very close to a massive companion galaxy. Compact elliptical galaxies (cEs), of which M32 is the prototype, have often been thought to be truncated due to their interactions with larger companions (e.g., King 1962; Bekki et al. 2001; Price et al. 2009). There are not many known cEs. Chilingarian et al. (2009) performed a search using the virtual observatory finding 14 confirmed cEs, none of which showing any young stellar populations. In an Integral Field Unit (IFU) study of compact ellipticals, Guérou et al. (2015) also found that only one of their eight targets has a stellar population of ∼3 Gyr, while the rest are older than 6 Gyr. Two of their seven objects in common are clearly redder than the red sequence in our paper. Using a sample of compact stellar systems and comparing them with globular clusters, and giant and dwarf galaxies, Janz et al. (2016) claimed that cEs are stripped massive galaxies, considering the fact that they have similar metallicities to dwarf nuclei and the center of massive early-type galaxies. They also reported that the outliers in the mass-metallicity relation are cEs (see Janz et al. 2016; Fig. 5), similar to what we showed here for red outlier compact dwarfs. Although the above scenario seems to explain the way the cEs form in Virgo, it is not the only formation theory.
All the red outliers in Virgo are compact early-type galaxies based on their effective radii, and are close companions to massive neighbors. Given the number of the red outlier cEs in Virgo cluster, one might expect there to be a similar number in the Coma and Fornax clusters. If the probability of finding red outlier cEs is the same in all three clusters, we would expect to have 2 ± 1 in Coma and 1 ± 1 in Fornax. The probability of finding zero red outliers in Coma is 10% and for Fornax, it is 23%. As discussed in Sect. 4.2, we did not find any in Coma or Fornax. Different statistics of compact dwarf galaxies in these clusters can provide a hint to their formation mechanism. One should keep in mind that ultra compact dwarfs are not considered here, since they fall outside our magnitude range (Drinkwater et al. 2000).
5.2. Blue-cored dEs
The most important result of this paper is the large fraction of dEs with young stellar populations in their centers. As discussed in Sect. 4.4, the number of blue-cored dEs changes from cluster to cluster. In Fornax, all the galaxies in our magnitude range have a bluer center than their host galaxies. In Virgo, about 85%±2% have a bluer center. In the Coma Cluster, a minimum of 53%±3% of the sample have a clear blue core. This is a lower limit for Coma cluster due to its distance, as explained in Sect. 4.5. Some of these galaxies contain a considerable amount of gas which has not been blown away. For example, Zabel et al. (2019) reported the detection of molecular CO in FCC335 and FCC90. The galaxies that have a straight color profile, that is, no core, could be galaxies with a small non-detectable core or a galaxy without any bluer or redder center (mostly found in the Coma cluster; see Fig. 9).
For all three clusters, most galaxies have an excess light from the fitted line, Xouterfit, in the interval [−0.05,0], as can be seen in Fig. 11. There are just a few galaxies with redder centers in the Virgo cluster and none in the other two clusters. We showed that the bluest cores are found in fainter galaxies. This result is compatible with the previous studies on the nuclei of dEs, except in those previous studies no distinction was made between the core, that is, the blue region, and the nucleus, the region with an enhanced surface brightness profile. Lotz et al. (2004), for the Leo Group, Fornax, and Virgo clusters ( − 12 < MB < −18), showed that the nuclei of dEs are bluer than their residing galaxies, δ(V − I)=0.1 − 0.15 mag, and that redder and brighter dEs have redder nuclei. These latter authors failed to find any correlation between nuclear properties such as magnitude and color and projected distance of the galaxy from the center. We also did not find any trend between the excess light from the fitted line and the projected distance of each galaxy to the cluster center.
Several studies have reported blue-cored early-type galaxies in various environments, associating them with recent star-formation in these areas. Beside their blue cores, the young stellar populations were confirmed using different tools such as Hα emission and UV flux. Pak et al. (2014) studied a sample of 166 galaxies in the Ursa Major cluster located at 17.4 Mpc (Tully & Courtois 2012; between those of Virgo and Fornax) with ground-based SDSS Data and data from the GALEX satellite. The sample of this latter study was chosen in the magnitude range of −21.5 < Mr < −13.5. In this range, 16 galaxies out of 23 dEs, that is ∼70%, showed a blue core based on their radial NUV-r color profiles. Pak et al. (2014) claimed that since the UV flux is particularly sensitive to the presence of young stars (< 1 Gyr), the blue UV-optical colors of the blue-cored early-type dwarfs indicate that these galaxies have experienced recent or ongoing star formation activity in their central regions. To confirm the recent star formation, the authors looked at the Hα emission of these galaxies, which is a good indicator of O- and B-type stars with an age of less than a few million years (Kennicutt 1998). They reported that about 75% of them have Hα emission with equivalent width of more than 2 Å.
In the Fornax cluster, De Rijcke et al. (2013) identified an offset blue core in FCC46, with Hα and H I emission indicating ongoing star formation. Lisker et al. (2006) sample the galaxies that overlap with this paper in the Virgo cluster; we also found blue cores in these galaxies (Sect. 4.4). The difference between the fractions of galaxies with blue cores is purely caused by a difference in resolution, and the fact that that the PSF of HST is so well known. Similar studies have confirmed ongoing star formation by Hα imaging (Boselli et al. 2008).
5.3. Size of the blue cores and comparison to nuclear clusters
Our method to find the blue or red cores in this paper is different from what has been used to detect the nuclei of early-type galaxies in HST studies of Fornax, Virgo, and Coma (Turner et al. 2012; Côté et al. 2006; Lotz et al. 2004; den Brok et al. 2014). Their detected nuclei are the excess light in the center of the galaxy when fitting a Sérsic function to the surface-brightness profile. Here, on the other hand, we used the color contrast to define the inner blue regions. The effective radii of the nuclei, determined from the surface-brightness profiles, are normally much smaller than our blue cores, indicating that they are not measuring the same thing.
Figure 14 shows the measured core size of the early-type galaxies in this paper versus the effective radii of the nuclei of the same galaxies from Côté et al. (2006; Virgo) and Turner et al. (2012; Fornax). As is seen in this image, our blue cores are generally larger than the nuclei. The two exceptions in Virgo, which have much larger nuclei than blue core radii, are VCC1630 and VCC1913. Galaxies without a detectable core or nucleus are shown as upper limits on the x = 0 or y = 0 lines. Although the nuclear clusters do not correspond one-to-one with the blue core regions, several studies have shown that the nuclear clusters are for the most part bluer than their host galaxies (Côté et al. 2004; Turner et al. 2012; den Brok et al. 2014). These studies also noted a (weak) correlation between the color of the nucleus and the luminosity of its galaxy, finding bluer nuclei to reside in fainter galaxies. This is comparable to the trend that we discussed in Fig. 11; fainter dEs on average show a larger blue excess.
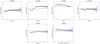 |
Fig. 14. Effective radii of the nuclei in the g-band vs. the radii of the cores of the dEs in Fornax and Virgo. The effective radii of the nuclei in Fornax were taken from Turner et al. (2012) and the ones in Virgo were taken from Côté et al. (2006). The core sizes are tabulated in Tables 4 and 5. |
We found that the size of the blue/red core of the galaxy does not correlate with the luminosity of the host galaxy; Fig. 10. Apart from the fact that the fraction of galaxies with blue or red cores differs from cluster to cluster, the properties of the cores vary so much from cluster to cluster that no general trends are seen. The only clear conclusion here is that no large core radii (> 300 pc) are seen in the Coma cluster.
5.4. Color gradients
The excellent spatial resolution also made it possible to determine accurate radial color gradients. We excluded the centers while calculating these gradients, similar to den Brok et al. (2011), since the color of the center of a dE is different from the rest of the galaxy. The observation by den Brok et al. (2011) that brighter galaxies mostly have negative gradients, after removing the blue cores, is mirrored in Fig. 13. The cluster environment can affect the color gradient by changing the star formation rate of a galaxy with various interactions that can happen. There are more galaxies with positive color gradients in Fornax and Virgo, whereas the color gradients of the galaxies in Coma are mostly negative. These positive gradients, common in fainter galaxies, could mean that our simple recipe, which assumes that the region containing young stellar populations is centrally concentrated, and that further out one sees a metallicity gradient in the old stellar populations, is no longer valid here. We note however that such galaxies are seen much more in Virgo and Fornax than in Coma. In addition, den Brok et al. (2011) did not find any relation of the gradient with cluster centric radius. COMAi13005.684p275535.20 is one of the galaxies that have a positive gradient in their sample and these latter authors presented this latter galaxy as a transition dwarf early-type galaxy with a spiral structure and central disk. COMAi13005.684p275535.20 is shown as the only blue outlier of the Coma sample in Fig. 5.
5.5. Comparison between the clusters and possible formation scenarios
In this paper, we studied three clusters with distinct characteristics. Comparing the environment of clusters, Coma is a relaxed, dense, and rich cluster at a distance of 100 Mpc (Carter et al. 2008). It is about a factor ten more massive than the Virgo cluster. Fornax, at a distance of 20 Mpc, is six times less massive, and is more regular in shape with a shallower potential well compared to Virgo (Jordán et al. 2007a; see Table 1). We see several differences in the galaxy properties. Can we understand these purely from the differences in cluster mass?
To study the effects of the cluster environment on the formation of galaxies, we used dwarf ellipticals as test objects, since their shallow gravitational potential causes them to interact more effectively with their environment. The most important external processes that can work here are ram pressure stripping (RPS; Gunn & Gott 1972) and harassment (Moore et al. 1996). These can remove the ISM of the galaxy, quench the star formation, and in the meantime even re-ignite the central star formation activity (Kronberger et al. 2008).
For the external factors that can affect dEs, Urich et al. (2017) discussed harassment and ram pressure stripping in the context of the formation of blue-cored dEs. These latter authors suggested that galaxy harassment is less effective in clusters like Virgo, given their large velocity dispersion, and more efficient in group environments (Yozin & Bekki 2015). Urich et al. (2017) claimed that the ram pressure stripping is therefore more likely to explain their blue-core dEs in the Virgo cluster. According to the model of Vollmer (2009), ram pressure stripping has a hard time in removing the gas from the center of the galaxies and it can even raise the star formation rate in the cores (Kronberger et al. 2008).
We found that the fraction of blue galaxies, measured as outliers from the red sequence on the blue side, is smaller in Coma than in Virgo and Fornax. We saw a similar effect when studying the fraction of galaxies with blue cores, and their sizes. Interestingly, Fornax does not seem to be very different here from Virgo, except that its CMR is slightly bluer than that of Virgo. If Coma has fewer blue outliers than Virgo, and fewer and smaller blue-core regions, then Virgo should have fewer blue outliers than Fornax. Since this is not the case, we probably have to look at the differences in the internal structures of Virgo and Fornax. The galaxy number density in the center of Fornax is twice as high as in the Virgo cluster (Jordán et al. 2007b), while the velocity dispersion in the Virgo cluster is two times higher (∼760 km s−1) than in Fornax, making the harassment timescales in the Virgo cluster four times longer than in the Fornax cluster (Venhola et al. 2018). On the other hand, the density of the X-ray gas in the center of Virgo (Simionescu et al. 2017) is roughly five times higher than in the Fornax cluster (Paolillo et al. 2002), which combined with the two-times-higher velocities of the Virgo dwarfs makes the ram-pressure in the Virgo cluster approximately 20 times higher than in the Fornax cluster. To this we have to add that in Fornax the ratio of ellipticals to spirals is larger than in Virgo (Ferguson & Sandage 1988). Virgo is an active and irregular cluster with a young dynamical nature (Boselli et al. 2014; Mei et al. 2007; Binggeli et al. 1993; Drinkwater et al. 2001; Conselice et al. 2001). Sybilska et al. (2017) showed that Virgo has a nonsymmetric density distribution by studying the number density map of the cluster.
Hence, with harassment being more effective in the central regions of Fornax and ram pressure stripping being more effective in Virgo, the effects seem to more or less cancel each other out. However, one thing is very different in these clusters: the fraction of red outliers of the CMR. Since the compact ellipticals that cause this are often caused by galaxy harassment or interactions, our observational result could indeed mean that harassment is much stronger in Virgo, meaning that bright nuclear dwarfs have a much higher probability of losing their outer parts. It would also mean that we expect more compact ellipticals in Coma; however, this is not the case since the cluster is much more relaxed now, and such objects are indistinguishable from stars with HST at this moment. Detailed simulations are needed to show whether this hypothesis is true, as well as observations covering a larger magnitude range to make stronger predictions.
We must also note that our sample of dEs in Coma used in this study is mostly from the central region of the cluster as the ACS camera failed during the later stages of the survey. Studies show that the color of a galaxy correlates with the density of its environment; redder galaxies reside in denser environments (Gavazzi et al. 2013; Boselli & Gavazzi 2014). Since the galaxies in the center of the cluster have entered the environment earlier and have gone through more environmental influences, they have less star formation (Sybilska et al. 2017; Lisker et al. 2013). This could well be the reason behind fewer blue outliers in Coma in Fig. 5.
Investigating the formation of dEs with a blue core, transition-type dwarf galaxies (TTDs) can be important. De Looze et al. (2013) chose their sample of 36 TTDs based on SDSS spectra of the Virgo cluster. From this sample, 13 of them were detected by the Herschel Space Observatory (Pilbratt et al. 2010) of which three galaxies are in common with our sample: VCC571, VCC1488, and VCC1499. The galaxy VCC571 has Hα absorption which is a sign of young stellar populations, and VCC1488 and VCC1499 have strong Hα absorption which shows relatively young ( ∼ 1 Gyr) stellar populations without current star formation, probably indicating a rapid truncation of the star formation activity. Transition-type dwarf galaxies are spiral galaxies loosing their gas entering the cluster environment and turning to quiescent dEs (Boselli et al. 2008; Lisker et al. 2006). In this process they can have properties of both early- and late-type galaxies. They claimed that several TTDs have blue central regions, which is a hint of outside-in gas removal. Regarding the blue-cored TTDs, these latter authors suggested that some of the dEs should be formed by infalling of the late-type galaxies in the field to the cluster and their transformation to early-type galaxies. The authors concluded that interaction with the cluster environment, especially through ram pressure striping, is guiding the evolution of these TTD.
What do these new results tell us about the formation of nuclear clusters? Turner et al. (2012), Côté et al. (2004) studied the nuclei of the dEs, taking advantage of the high resolution of HST. They analyzed the parameters of the nuclei and their projected distances from the cluster center and found similar results to ours; they did not find any evidence that their properties depend on galaxy cluster distance. In addition, the similarities between the nuclei of the early-type galaxies in our three clusters with distinct properties lead the authors to the conclusion that the environment of the clusters does not have a crucial effect on their formation and evolution. Considering these results, one may conclude that the formation of nuclei in dEs is mainly determined by internal and local factors. There are two main possible scenarios for their formation: infall of globular clusters or infall of gas to the center of the galaxy. Considering the former, globular clusters around the core experience dynamical friction, merge, and spiral to the center. This is not a new idea; Tremaine et al. (1975) suggested that the nucleus of M31 formed in the same way. This process leads to a lack of or less globular cluster around the center (Capuzzo-Dolcetta & Tesseri 1999). Calculating the timescale of dynamical friction in numerical simulations, Turner et al. (2012) concluded that the nuclei of the galaxies in the range of low to intermediate mass can be formed by this mechanism and that it is appropriate for forming the nuclei of nonmassive galaxies in their Virgo and Fornax samples (see more in e.g. Lotz et al. 2001; Milosavljević 2004).
The latter possible scenario that can form the nuclei is gas accretion into the center, which causes star formation in the core of the galaxy (van den Bergh 1986). There are some theories explaining how gas is transported to the inner parts of the galaxy (Milosavljević 2004; Mihos & Hernquist 1994; Hopkins & Quataert 2011). Bekki et al. (2006) and Bekki (2007) with chemodynamic simulations of the inner 1 kpc of dwarf galaxies showed that nuclei are younger and more metal rich than their hosts. Since feedback is more effective in low-mass galaxies, the time that gas needs to settle in the center increases for fainter galaxies. This leads to the bluer and younger nuclei in low-mass galaxies.
6. Conclusion
We conclude by stating the main results of this paper:
-
The most important result is the large number of blue-cored dEs in all three clusters: all galaxies in the Fornax cluster sample, 85%±2% of the Virgo sample, and a lower limit of 53%±3% in the Coma cluster sample, which is discussed in detail in Sect. 4.4. Considering the very distinct characteristics of these clusters and the distribution of these galaxies in each cluster, their formation and evolution are influenced by different factors and cannot be explained by a single theory. The possible scenarios are presented in Sect. 5.5.
-
We found that in the magnitude interval of −18.7 ≤ Mg′ ≤ −16.0, the scatter in the CMR is the highest in Virgo, 0.144 mag. In Fornax and Coma the scatter is 0.060 and 0.065 mag, respectively. The large number of outliers on its blue side shows that the Virgo cluster dwarfs are still quite actively forming stars. The same is true for the Fornax cluster. The scatter on the blue side of the CMR is due to galaxies with young stellar populations. This is mainly the case in Fornax and Virgo. Their fractions are 11%±2%, 15%±3%, and 2%±1% of the total dwarf early-type galaxies in Fornax, Virgo, and the central regions of Coma, respectively. The galaxies in Fornax and Virgo in general are probably somewhat younger.
-
The situation with the red outliers is totally different in Virgo, as compared to the other clusters. All the red outliers of the color–magnitude diagram in the Virgo cluster are compact ellipticals. Their redder color can probably be explained by tidal interactions with large nearby massive galaxies. There are three red outlier compact galaxies in Virgo and none in the Fornax and Coma clusters. The fact that there are more red outliers in Virgo, a cluster with more ongoing interactions, and that these are cEs, probably means that the environment is still very active, with many galaxy-galaxy interactions, more than in the other clusters. To fully test this idea, much larger sample sizes are needed for statistical significance.
-
A trend that brighter galaxies generally have negative color gradients, which become less negative and even positive for our faintest galaxies, can be found in the color gradients of all three clusters.
-
The bluest cores are found in the faintest galaxies. There is no obvious correlation between the sizes of the blue cores and the luminosity of their host galaxies in any of the clusters.
Acknowledgments
RFP acknowledges financial support from the European Union’s Horizon 2020 research and innovation programme under Marie Skodowska-Curie grant agreement No 721463 to the SUNDIAL ITN network.
References
- Baldry, I. K., Glazebrook, K., Brinkmann, J., et al. 2004, ApJ, 600, 681 [NASA ADS] [CrossRef] [Google Scholar]
- Bekki, K. 2007, PASA, 24, 77 [NASA ADS] [CrossRef] [Google Scholar]
- Bekki, K., Couch, W. J., Drinkwater, M. J., & Gregg, M. D. 2001, ApJ, 557, L39 [NASA ADS] [CrossRef] [Google Scholar]
- Bekki, K., Couch, W. J., & Shioya, Y. 2006, ApJ, 642, L133 [NASA ADS] [CrossRef] [Google Scholar]
- Bell, E. F., Wolf, C., Meisenheimer, K., et al. 2004, ApJ, 608, 752 [NASA ADS] [CrossRef] [Google Scholar]
- Binggeli, B., Sandage, A., & Tammann, G. A. 1985, AJ, 90, 1681 [NASA ADS] [CrossRef] [Google Scholar]
- Binggeli, B., Tammann, G. A., & Sandage, A. 1987, AJ, 94, 251 [NASA ADS] [CrossRef] [Google Scholar]
- Binggeli, B., Popescu, C. C., & Tammann, G. A. 1993, A&AS, 98, 275 [NASA ADS] [Google Scholar]
- Blakeslee, J. P., Jordán, A., Mei, S., et al. 2009, ApJ, 694, 556 [NASA ADS] [CrossRef] [Google Scholar]
- Boselli, A., & Gavazzi, G. 2014, A&ARv, 22, 74 [NASA ADS] [CrossRef] [Google Scholar]
- Boselli, A., Boissier, S., Cortese, L., & Gavazzi, G. 2008, ApJ, 674, 742 [NASA ADS] [CrossRef] [Google Scholar]
- Boselli, A., Voyer, E., Boissier, S., et al. 2014, A&A, 570, A69 [NASA ADS] [CrossRef] [EDP Sciences] [Google Scholar]
- Bower, R. G., Lucey, J. R., & Ellis, R. S. 1992, MNRAS, 254, 601 [NASA ADS] [CrossRef] [Google Scholar]
- Bruzual, G., & Charlot, S. 2003, MNRAS, 344, 1000 [NASA ADS] [CrossRef] [Google Scholar]
- Capuzzo-Dolcetta, R., & Tesseri, A. 1999, MNRAS, 308, 961 [NASA ADS] [CrossRef] [Google Scholar]
- Carter, D., Goudfrooij, P., Mobasher, B., et al. 2008, ApJS, 176, 424 [NASA ADS] [CrossRef] [Google Scholar]
- Chilingarian, I., Cayatte, V., Revaz, Y., et al. 2009, Science, 326, 1379 [NASA ADS] [CrossRef] [PubMed] [Google Scholar]
- Choi, J., Conroy, C., Moustakas, J., et al. 2014, ApJ, 792, 95 [NASA ADS] [CrossRef] [Google Scholar]
- Colless, M., & Dunn, A. M. 1996, ApJ, 458, 435 [NASA ADS] [CrossRef] [Google Scholar]
- Conselice, C. J., Gallagher, III., J. S., & Wyse, R. F. G. 2001, ApJ, 559, 791 [NASA ADS] [CrossRef] [Google Scholar]
- Conselice, C. J., O’Neil, K., Gallagher, J. S., & Wyse, R. F. G. 2003, ApJ, 591, 167 [NASA ADS] [CrossRef] [Google Scholar]
- Côté, P., Blakeslee, J. P., Ferrarese, L., et al. 2004, ApJS, 153, 223 [NASA ADS] [CrossRef] [Google Scholar]
- Côté, P., Piatek, S., Ferrarese, L., et al. 2006, ApJS, 165, 57 [NASA ADS] [CrossRef] [MathSciNet] [Google Scholar]
- De Looze, I., Baes, M., Zibetti, S., et al. 2010, A&A, 518, L54 [NASA ADS] [CrossRef] [EDP Sciences] [Google Scholar]
- De Looze, I., Baes, M., Boselli, A., et al. 2013, MNRAS, 436, 1057 [NASA ADS] [CrossRef] [Google Scholar]
- De Rijcke, S., Van Hese, E., & Buyle, P. 2010, ApJ, 724, L171 [NASA ADS] [CrossRef] [Google Scholar]
- De Rijcke, S., Buyle, P., & Koleva, M. 2013, ApJ, 770, L26 [NASA ADS] [CrossRef] [Google Scholar]
- den Brok, M., Peletier, R. F., Valentijn, E. A., et al. 2011, MNRAS, 414, 3052 [Google Scholar]
- den Brok, M., Peletier, R. F., Seth, A., et al. 2014, MNRAS, 445, 2385 [NASA ADS] [CrossRef] [Google Scholar]
- Drinkwater, M. J., Jones, J. B., Gregg, M. D., & Phillipps, S. 2000, PASA, 17, 227 [NASA ADS] [CrossRef] [Google Scholar]
- Drinkwater, M. J., Gregg, M. D., Holman, B. A., & Brown, M. J. I. 2001, MNRAS, 326, 1076 [Google Scholar]
- Durrell, P. R. 1997, AJ, 113, 531 [NASA ADS] [CrossRef] [Google Scholar]
- Eisenhardt, P. R., De Propris, R., Gonzalez, A. H., et al. 2007, ApJS, 169, 225 [NASA ADS] [CrossRef] [Google Scholar]
- Falco, M., Hansen, S. H., Wojtak, R., et al. 2014, MNRAS, 442, 1887 [NASA ADS] [CrossRef] [Google Scholar]
- Ferguson, H. C. 1989, AJ, 98, 367 [Google Scholar]
- Ferguson, H. C., & Binggeli, B. 1994, A&ARv, 6, 67 [NASA ADS] [CrossRef] [Google Scholar]
- Ferguson, H. C., & Sandage, A. 1988, AJ, 96, 1520 [NASA ADS] [CrossRef] [Google Scholar]
- Ferrarese, L., Côté, P., Jordán, A., et al. 2006, ApJS, 164, 334 [NASA ADS] [CrossRef] [Google Scholar]
- Ferrarese, L., Côté, P., Cuillandre, J.-C., et al. 2012, ApJS, 200, 4 [NASA ADS] [CrossRef] [Google Scholar]
- Franx, M., Illingworth, G., & Heckman, T. 1989, ApJ, 344, 613 [NASA ADS] [CrossRef] [Google Scholar]
- Gavazzi, G., Cortese, L., Boselli, A., et al. 2003, ApJ, 597, 210 [NASA ADS] [CrossRef] [Google Scholar]
- Gavazzi, G., Savorgnan, G., Fossati, M., et al. 2013, A&A, 553, A90 [NASA ADS] [CrossRef] [EDP Sciences] [Google Scholar]
- Gil de Paz, A., Boissier, S., Madore, B. F., et al. 2007, ApJS, 173, 185 [NASA ADS] [CrossRef] [Google Scholar]
- Grant, N. I., Kuipers, J. A., & Phillipps, S. 2005, MNRAS, 363, 1019 [NASA ADS] [CrossRef] [Google Scholar]
- Grebel, E. K. 2001, Astrophys. Space Sci. Suppl., 277, 231 [NASA ADS] [CrossRef] [Google Scholar]
- Gu, Q., Zhao, Y., Shi, L., Peng, Z., & Luo, X. 2006, AJ, 131, 806 [NASA ADS] [CrossRef] [Google Scholar]
- Guérou, A., Emsellem, E., McDermid, R. M., et al. 2015, ApJ, 804, 70 [NASA ADS] [CrossRef] [Google Scholar]
- Gunn, J. E., & Gott, III., J. R. 1972, ApJ, 176, 1 [NASA ADS] [CrossRef] [Google Scholar]
- Hammer, D., Verdoes Kleijn, G., Hoyos, C., et al. 2010, ApJS, 191, 143 [NASA ADS] [CrossRef] [Google Scholar]
- Hodge, P. W. 1973, AJ, 78, 807 [NASA ADS] [CrossRef] [Google Scholar]
- Hopkins, P. F., & Quataert, E. 2011, MNRAS, 411, L61 [NASA ADS] [CrossRef] [Google Scholar]
- Hoyos, C., den Brok, M., Verdoes Kleijn, G., et al. 2011, MNRAS, 411, 2439 [NASA ADS] [CrossRef] [Google Scholar]
- Janz, J., & Lisker, T. 2009, ApJ, 696, L102 [NASA ADS] [CrossRef] [Google Scholar]
- Janz, J., Norris, M. A., Forbes, D. A., et al. 2016, MNRAS, 456, 617 [NASA ADS] [CrossRef] [Google Scholar]
- Jerjen, H., Kalnajs, A., & Binggeli, B. 2000, A&A, 358, 845 [NASA ADS] [Google Scholar]
- Jordán, A., Blakeslee, J. P., Peng, E. W., et al. 2004, ApJS, 154, 509 [NASA ADS] [CrossRef] [Google Scholar]
- Jordán, A., Blakeslee, J. P., Côté, P., et al. 2007a, ApJS, 169, 213 [NASA ADS] [CrossRef] [Google Scholar]
- Jordán, A., McLaughlin, D. E., Côté, P., et al. 2007b, ApJS, 171, 101 [NASA ADS] [CrossRef] [Google Scholar]
- Jorgensen, I., Franx, M., & Kjaergaard, P. 1992, A&AS, 95, 489 [NASA ADS] [Google Scholar]
- Kennicutt, Jr., R. C. 1998, ARA&A, 36, 189 [Google Scholar]
- King, I. 1962, AJ, 67, 471 [NASA ADS] [CrossRef] [Google Scholar]
- Koch, A., Black, C. S., Rich, R. M., et al. 2017, Astron. Nachr., 338, 503 [NASA ADS] [CrossRef] [Google Scholar]
- Krist, J. E., Hook, R. N., & Stoehr, F. 2011, Optical Modeling and Performance Predictions V, 8127, 81270J [Google Scholar]
- Kronberger, T., Kapferer, W., Ferrari, C., Unterguggenberger, S., & Schindler, S. 2008, A&A, 481, 337 [NASA ADS] [CrossRef] [EDP Sciences] [Google Scholar]
- Kubo, J. M., Stebbins, A., Annis, J., et al. 2007, ApJ, 671, 1466 [NASA ADS] [CrossRef] [Google Scholar]
- Lisker, T., Glatt, K., Westera, P., & Grebel, E. K. 2006, AJ, 132, 2432 [NASA ADS] [CrossRef] [Google Scholar]
- Lisker, T., Grebel, E. K., Binggeli, B., & Glatt, K. 2007, ApJ, 660, 1186 [NASA ADS] [CrossRef] [Google Scholar]
- Lisker, T., Weinmann, S. M., Janz, J., & Meyer, H. T. 2013, MNRAS, 432, 1162 [NASA ADS] [CrossRef] [Google Scholar]
- Lotz, J. M., Telford, R., Ferguson, H. C., et al. 2001, ApJ, 552, 572 [NASA ADS] [CrossRef] [Google Scholar]
- Lotz, J. M., Miller, B. W., & Ferguson, H. C. 2004, ApJ, 613, 262 [NASA ADS] [CrossRef] [MathSciNet] [Google Scholar]
- Mastropietro, C., Moore, B., Mayer, L., et al. 2005, MNRAS, 364, 607 [Google Scholar]
- McLaughlin, D. E. 1999, ApJ, 512, L9 [NASA ADS] [CrossRef] [Google Scholar]
- Mei, S., Blakeslee, J. P., Côté, P., et al. 2007, ApJ, 655, 144 [NASA ADS] [CrossRef] [Google Scholar]
- Mihos, J. C., & Hernquist, L. 1994, ApJ, 437, L47 [NASA ADS] [CrossRef] [Google Scholar]
- Milosavljević, M. 2004, ApJ, 605, L13 [NASA ADS] [CrossRef] [Google Scholar]
- Moore, B., Katz, N., Lake, G., Dressler, A., & Oemler, A. 1996, Nature, 379, 613 [NASA ADS] [CrossRef] [Google Scholar]
- Muzzin, A., Wilson, G., Yee, H. K. C., et al. 2009, ApJ, 698, 1934 [NASA ADS] [CrossRef] [Google Scholar]
- Pak, M., Rey, S.-C., Lisker, T., et al. 2014, MNRAS, 445, 630 [NASA ADS] [CrossRef] [Google Scholar]
- Paolillo, M., Fabbiano, G., Peres, G., & Kim, D.-W. 2002, ApJ, 565, 883 [NASA ADS] [CrossRef] [Google Scholar]
- Peletier, R. F. 1993, A&A, 271, 51 [NASA ADS] [Google Scholar]
- Peletier, R. F., Valentijn, E. A., Moorwood, A. F. M., & Freudling, W. 1994, A&AS, 108, 621 [NASA ADS] [Google Scholar]
- Peletier, R. F., Kutdemir, E., van der Wolk, G., et al. 2012, MNRAS, 419, 2031 [NASA ADS] [CrossRef] [Google Scholar]
- Pilbratt, G. L., Riedinger, J. R., Passvogel, T., et al. 2010, A&A, 518, L1 [CrossRef] [EDP Sciences] [Google Scholar]
- Price, J., Phillipps, S., Huxor, A., et al. 2009, MNRAS, 397, 1816 [NASA ADS] [CrossRef] [Google Scholar]
- Roediger, J. C., Ferrarese, L., Côté, P., et al. 2017, ApJ, 836, 120 [NASA ADS] [CrossRef] [Google Scholar]
- Ryś, A., Koleva, M., Falcón-Barroso, J., et al. 2015, MNRAS, 452, 1888 [NASA ADS] [CrossRef] [Google Scholar]
- Sánchez-Blázquez, P., Rosales-Ortega, F., Diaz, A., & Sánchez, S. F. 2014, MNRAS, 437, 1534 [NASA ADS] [CrossRef] [Google Scholar]
- Sandage, A. 1972, ApJ, 176, 21 [NASA ADS] [CrossRef] [Google Scholar]
- Sandage, A., & Binggeli, B. 1984, AJ, 89, 919 [NASA ADS] [CrossRef] [Google Scholar]
- Sandage, A., & Visvanathan, N. 1978, ApJ, 223, 707 [NASA ADS] [CrossRef] [Google Scholar]
- Schlegel, D. J., Finkbeiner, D. P., & Davis, M. 1998, ApJ, 500, 525 [NASA ADS] [CrossRef] [Google Scholar]
- Schombert, J. M. 2018, AJ, 155, 69 [NASA ADS] [CrossRef] [Google Scholar]
- Schweizer, F., & Seitzer, P. 1992, AJ, 104, 1039 [NASA ADS] [CrossRef] [Google Scholar]
- Silk, J., & Mamon, G. A. 2012, Res. Astron. Astrophys., 12, 917 [NASA ADS] [CrossRef] [Google Scholar]
- Simionescu, A., Werner, N., Mantz, A., Allen, S. W., & Urban, O. 2017, MNRAS, 469, 1476 [NASA ADS] [CrossRef] [Google Scholar]
- Sirianni, M., Jee, M. J., Benítez, N., et al. 2005, PASP, 117, 1049 [NASA ADS] [CrossRef] [Google Scholar]
- Stott, J. P., Pimbblet, K. A., Edge, A. C., Smith, G. P., & Wardlow, J. L. 2009, MNRAS, 394, 2098 [NASA ADS] [CrossRef] [Google Scholar]
- Sybilska, A., Lisker, T., Kuntschner, H., et al. 2017, MNRAS, 470, 815 [NASA ADS] [CrossRef] [Google Scholar]
- Taylor, E. N., Franx, M., van Dokkum, P. G., et al. 2009, ApJS, 183, 295 [NASA ADS] [CrossRef] [Google Scholar]
- Thomas, D., Maraston, C., Bender, R., & Mendes de Oliveira, C. 2005, ApJ, 621, 673 [NASA ADS] [CrossRef] [Google Scholar]
- Tolstoy, E., Hill, V., & Tosi, M. 2009, ARA&A, 47, 371 [NASA ADS] [CrossRef] [Google Scholar]
- Tremaine, S. D., Ostriker, J. P., & Spitzer, Jr., L. 1975, ApJ, 196, 407 [NASA ADS] [CrossRef] [Google Scholar]
- Tully, R. B., & Courtois, H. M. 2012, ApJ, 749, 78 [NASA ADS] [CrossRef] [Google Scholar]
- Turner, M. L., Côté, P., Ferrarese, L., et al. 2012, ApJS, 203, 5 [NASA ADS] [CrossRef] [Google Scholar]
- Urich, L., Lisker, T., Janz, J., et al. 2017, A&A, 606, A135 [NASA ADS] [CrossRef] [EDP Sciences] [Google Scholar]
- van den Bergh, S. 1986, AJ, 91, 271 [NASA ADS] [CrossRef] [Google Scholar]
- Venhola, A., Peletier, R., Laurikainen, E., et al. 2018, A&A, 620, A165 [NASA ADS] [CrossRef] [EDP Sciences] [Google Scholar]
- Vigroux, L., Souviron, J., & Vader, J. P. 1984, A&A, 139, L9 [NASA ADS] [Google Scholar]
- Vollmer, B. 2009, A&A, 502, 427 [NASA ADS] [CrossRef] [EDP Sciences] [Google Scholar]
- Yozin, C., & Bekki, K. 2015, MNRAS, 453, 2302 [NASA ADS] [Google Scholar]
- Zabel, N., Davis, T. A., Smith, M. W. L., et al. 2019, MNRAS, 483, 2251 [NASA ADS] [CrossRef] [Google Scholar]
Appendix A: Color profiles of Virgo and table of Coma dE color profile parameters
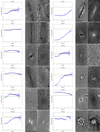 |
Fig. A.1. Color profile of Virgo early-type dwarf galaxies. |
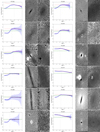 |
Fig. A.1. continued. |
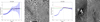 |
Fig. A.1. continued. |
Coma dE color profile parameters.
All Tables
All Figures
|
Fig. 1. Histogram of the projected distance from the center normalized to the Virial radius of the cluster. Different colors are used for each cluster. |
| In the text | |
|
Fig. 2. Difference between tabulated (g′−z′) colors in Table 2 and calculated colors in Blakeslee et al. (2009) for Fornax vs. g′-band magnitude. The two outliers, FCC90 and FCC26, have very blue extended cores in Fig. 8. |
| In the text | |
|
Fig. 3. Ratio of effective radii in g′- and z′-bands vs. absolute magnitude in g′-band. The dashed line is |
| In the text | |
|
Fig. 4. Ratio of effective radii of Ferguson (1989) to the effective radii in g′-band in this paper vs. total magnitude of the galaxy in g′-band. The dashed line is Re(Ferguson)=Re(new). |
| In the text | |
|
Fig. 5. Color–magnitude diagram of bright dEs from Fornax (this study), Virgo (Ferrarese et al. 2006), and Coma (Hammer et al. 2010). The color codes of least-squares fitted lines are the same as for the points; red for Fornax, blue for Virgo, and green for the Coma cluster. The fitted lines in the upper panel are least-squares fits for each cluster. In the lower panel we fixed the slope of the fitted lines to the slope of the CMR in Coma as determined in the upper panel. All the parameters of the lines are given in Table 3. The VCC and FCC numbers of the red and blue outliers in the Virgo and Fornax clusters are indicated. The gray area shows the area of ±2σ away from the CMR of Coma. The colors and magnitudes have been corrected for galactic extinction. |
| In the text | |
|
Fig. 6. Distribution of the difference between the color of a galaxy in our sample and its expected color from the CMR of the Coma in Fig. 5. |
| In the text | |
|
Fig. 7. Δcolor vs. normalized effective radius in g′ for the bright dEs in Fornax, Virgo, and Coma. Δcolor is the difference between the color of a galaxy in our sample and its expected color from the CMR of the Coma cluster (color residual). Here the effective radius is divided by the expected radius from Re vs. magnitude relations in each cluster: Eqs. (4), (5), and (6). The vertical dashed line corresponds to the CMR of Coma and the horizontal dashed line is Re = Rref. The gray area corresponds to the gray area of Fig. 5. |
| In the text | |
|
Fig. 8. Color profiles (color-log(r)) and unsharp masked and color images of the Fornax early-type dwarf galaxies. In the color profiles, the green line shows the color of the CMR in that magnitude. The red line is fitted to the outer part of the profile and the black dashed line separates the inner part from the outer part of the galaxy. The width of the unsharp masked and the color images is 26″ and the color of the unsharp masked image is inverted. |
| In the text | |
|
Fig. 8. continued. |
| In the text | |
|
Fig. 8. continued. |
| In the text | |
|
Fig. 9. Simulation of the color profile of FCC301 at the distance of Coma in red, together with its original color profile in blue. |
| In the text | |
|
Fig. 10. Core size vs. magnitude in the Fornax, Virgo, and Coma clusters. The yellow markers show the change of the core size for FCC301 before and after (marked with an “x” sign) putting it at the distance of Coma. The zero core size could be a nondetectable core or a galaxy without a core. |
| In the text | |
|
Fig. 11. Excess from the fitted red line (Xouter fit) vs. magnitude in the Fornax, Virgo, and Coma clusters. As the yellow makers show for FCC301, the excess light drops to zero after putting it at the distance of Coma (the one at the distance of Coma has a “n” “x” symbol on it). A negative (positive) excess is driven by a bluer (redder) center than the galaxy. The very large core sizes are galaxies with extended blue cores. |
| In the text | |
|
Fig. 12. Excess light from the CMR line vs. magnitude in the Fornax, Virgo, and Coma clusters. The yellow point with an “x” symbol on it shows FCC301 before and after it was simulated to be at the distance of Coma. XCMR does not change after convolution. The extreme negative points are galaxies with young stellar populations and the most positive ones are dusty galaxies. |
| In the text | |
|
Fig. 13. Color gradient vs. magnitude for the Fornax, Virgo, and Coma clusters. The yellow points show FCC301 before and after (with an “x” symbol on it) simulated at the Coma distance. |
| In the text | |
|
Fig. 14. Effective radii of the nuclei in the g-band vs. the radii of the cores of the dEs in Fornax and Virgo. The effective radii of the nuclei in Fornax were taken from Turner et al. (2012) and the ones in Virgo were taken from Côté et al. (2006). The core sizes are tabulated in Tables 4 and 5. |
| In the text | |
|
Fig. A.1. Color profile of Virgo early-type dwarf galaxies. |
| In the text | |
|
Fig. A.1. continued. |
| In the text | |
|
Fig. A.1. continued. |
| In the text | |
Current usage metrics show cumulative count of Article Views (full-text article views including HTML views, PDF and ePub downloads, according to the available data) and Abstracts Views on Vision4Press platform.
Data correspond to usage on the plateform after 2015. The current usage metrics is available 48-96 hours after online publication and is updated daily on week days.
Initial download of the metrics may take a while.