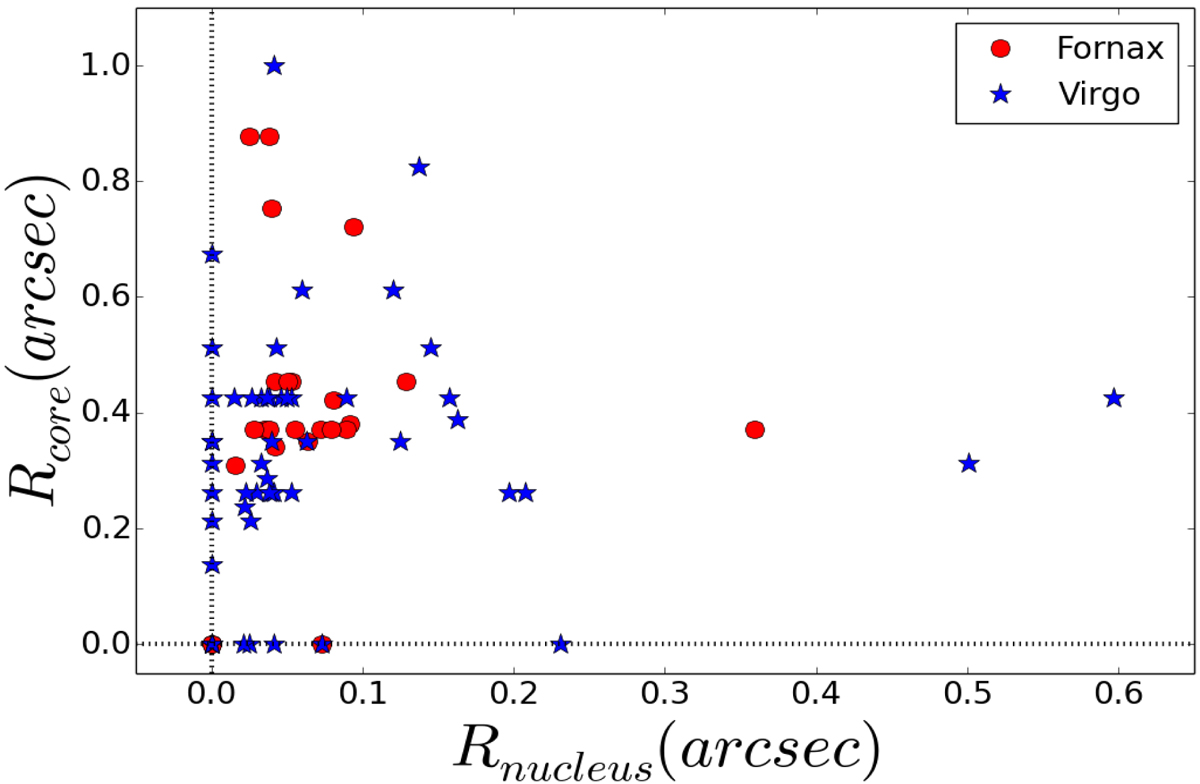
Fig. 11.

Excess from the fitted red line (Xouter fit) vs. magnitude in the Fornax, Virgo, and Coma clusters. As the yellow makers show for FCC301, the excess light drops to zero after putting it at the distance of Coma (the one at the distance of Coma has a “n” “x” symbol on it). A negative (positive) excess is driven by a bluer (redder) center than the galaxy. The very large core sizes are galaxies with extended blue cores.
Current usage metrics show cumulative count of Article Views (full-text article views including HTML views, PDF and ePub downloads, according to the available data) and Abstracts Views on Vision4Press platform.
Data correspond to usage on the plateform after 2015. The current usage metrics is available 48-96 hours after online publication and is updated daily on week days.
Initial download of the metrics may take a while.


