Fig. 5.
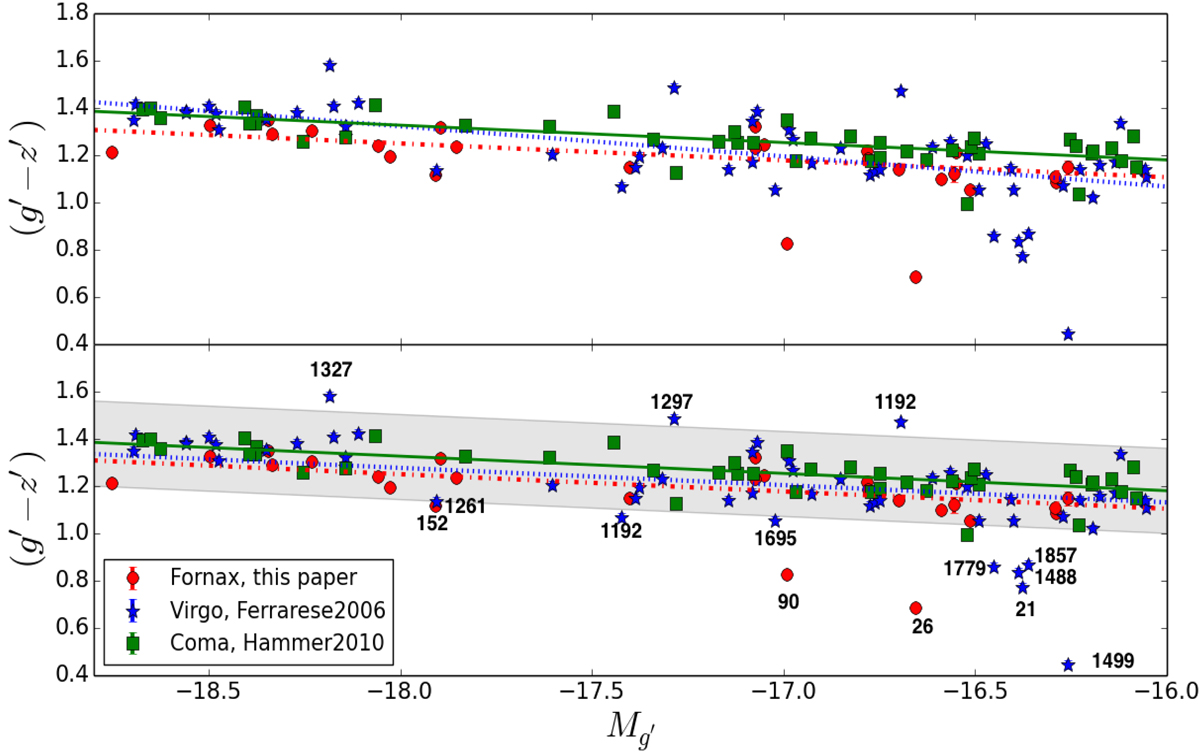
Color–magnitude diagram of bright dEs from Fornax (this study), Virgo (Ferrarese et al. 2006), and Coma (Hammer et al. 2010). The color codes of least-squares fitted lines are the same as for the points; red for Fornax, blue for Virgo, and green for the Coma cluster. The fitted lines in the upper panel are least-squares fits for each cluster. In the lower panel we fixed the slope of the fitted lines to the slope of the CMR in Coma as determined in the upper panel. All the parameters of the lines are given in Table 3. The VCC and FCC numbers of the red and blue outliers in the Virgo and Fornax clusters are indicated. The gray area shows the area of ±2σ away from the CMR of Coma. The colors and magnitudes have been corrected for galactic extinction.
Current usage metrics show cumulative count of Article Views (full-text article views including HTML views, PDF and ePub downloads, according to the available data) and Abstracts Views on Vision4Press platform.
Data correspond to usage on the plateform after 2015. The current usage metrics is available 48-96 hours after online publication and is updated daily on week days.
Initial download of the metrics may take a while.