Fig. 6.
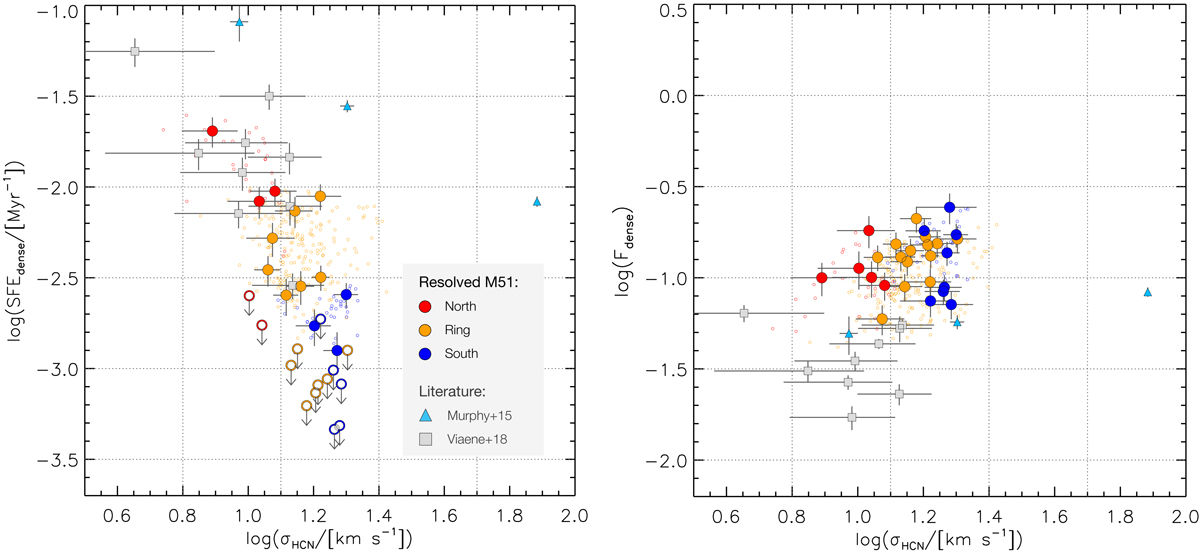
Star formation efficiency of the dense gas (SFEdense = ΣSFR/Σdense, left) and dense gas fraction (Fdense = Σdense/Σmol, right) as a function of the local velocity dispersion of HCN. The filled circles show results for 3″ apertures (∼100 pc) centred on HCN peaks, while the small open circles in the background represent all detections across our fields of view (above 3σ simultaneously for SFEdense, Fdense, and σHCN). The right panel shows more detections because the signal-to-noise ratio in CO and HCN is high compared to 33 GHz (limiting the detections on the left panel). Open circles with a downward arrow indicate upper limits. The blue triangles and gray squares correspond to measurements at comparable scales for NGC 3627 (Murphy et al. 2015) and M 31 (Brouillet et al. 2005, and new SFRs described in the text).
Current usage metrics show cumulative count of Article Views (full-text article views including HTML views, PDF and ePub downloads, according to the available data) and Abstracts Views on Vision4Press platform.
Data correspond to usage on the plateform after 2015. The current usage metrics is available 48-96 hours after online publication and is updated daily on week days.
Initial download of the metrics may take a while.