Fig. 5.
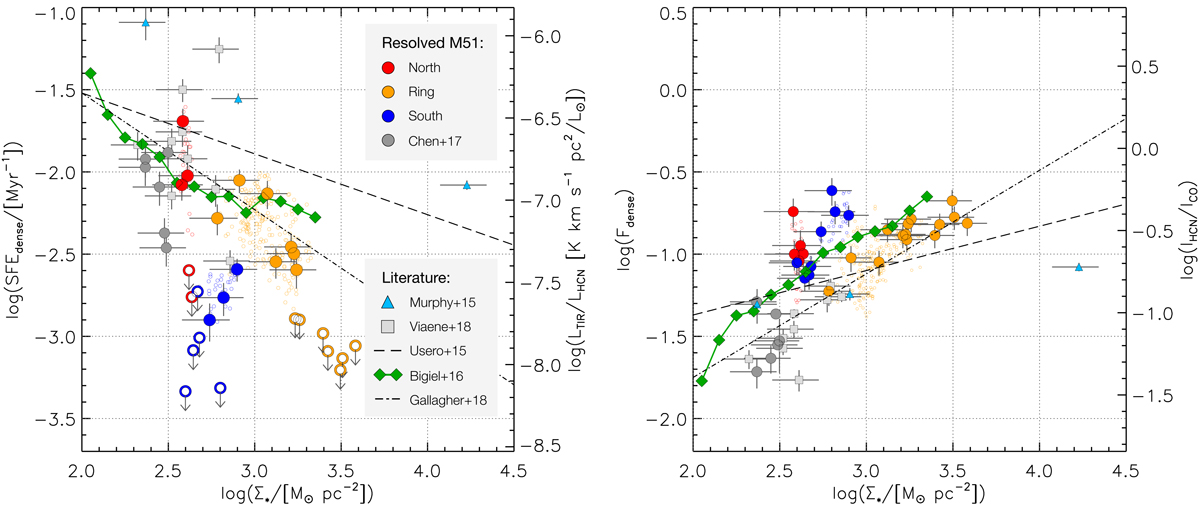
Star formation efficiency of the dense gas (SFEdense = ΣSFR/Σdense, left) and dense gas fraction (Fdense = Σdense/Σmol, right) as a function of local stellar mass surface density. The filled circles show results for 3″ apertures (∼100 pc) centred on HCN peaks, while the small open circles in the background represent all detections across our fields of view (above 3σ simultaneously for SFEdense, Fdense, and Σ⋆). Open circles with a downward arrow indicate upper limits. The blue triangles and gray squares correspond to measurements at comparable scales for NGC 3627 (Murphy et al. 2015) and M 31 (Brouillet et al. 2005, and new SFRs described in the text). The green diamonds connected by a solid line are the running medians from Bigiel et al. (2016) from their single-dish map of the entire M 51 disc (28″ ∼ 1 kpc resolution). The dashed black lines are the best-fit regressions from Usero et al. (2015), for single-dish HCN observations of nearby galaxies at kpc-scale resolution. The dashed-dotted black lines are the fits to the ALMA observations presented in Gallagher et al. (2018a) for four nearby galaxies, with a synthesised beam of a few hundred parsec sampled in radial bins.
Current usage metrics show cumulative count of Article Views (full-text article views including HTML views, PDF and ePub downloads, according to the available data) and Abstracts Views on Vision4Press platform.
Data correspond to usage on the plateform after 2015. The current usage metrics is available 48-96 hours after online publication and is updated daily on week days.
Initial download of the metrics may take a while.