Fig. 4.
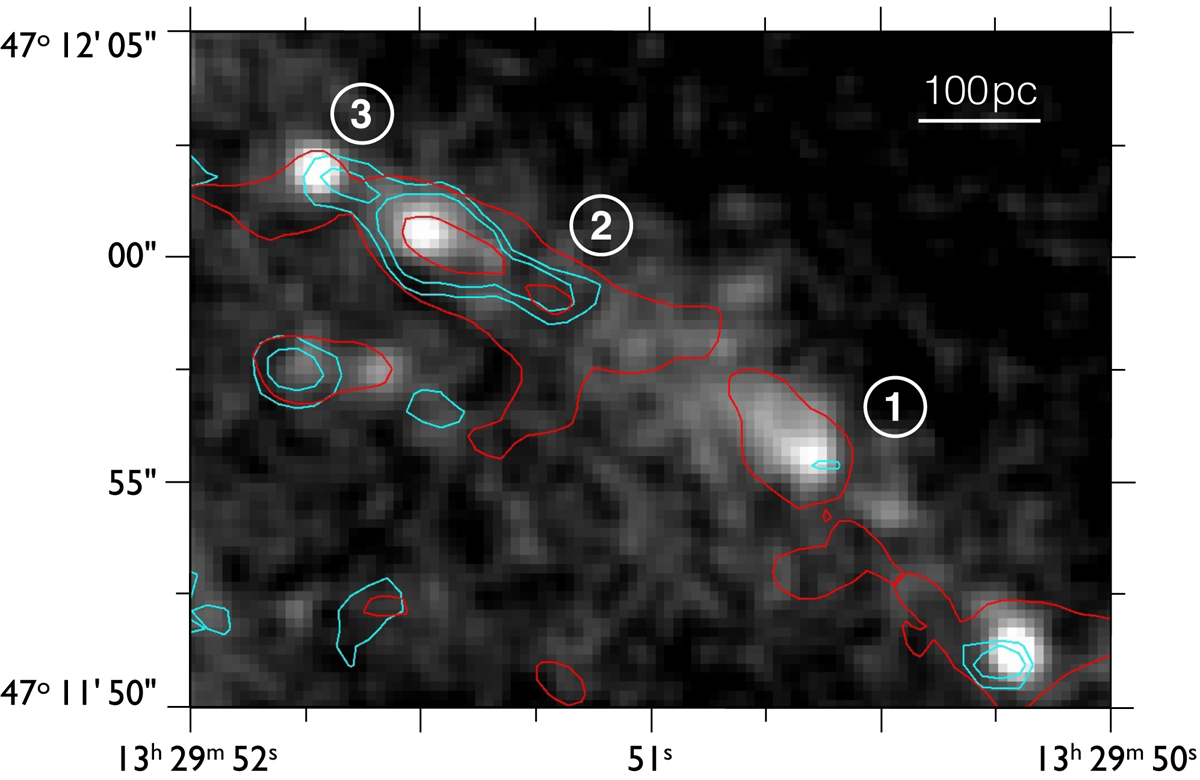
Spatial offsets between gas and SFR tracers in the north-western part of the star-forming ring in M 51. The background grayscale map is a ∼1″ resolution version of the 33 GHz continuum map. Cyan contours correspond to HCN(1–0) emission at ∼1.3″ resolution (levels [6, 8] K km s−1), and red contours correspond to CO(1–0) emission at ∼1″ resolution (levels [150, 350] K km s−1).
Current usage metrics show cumulative count of Article Views (full-text article views including HTML views, PDF and ePub downloads, according to the available data) and Abstracts Views on Vision4Press platform.
Data correspond to usage on the plateform after 2015. The current usage metrics is available 48-96 hours after online publication and is updated daily on week days.
Initial download of the metrics may take a while.