Fig. 3.
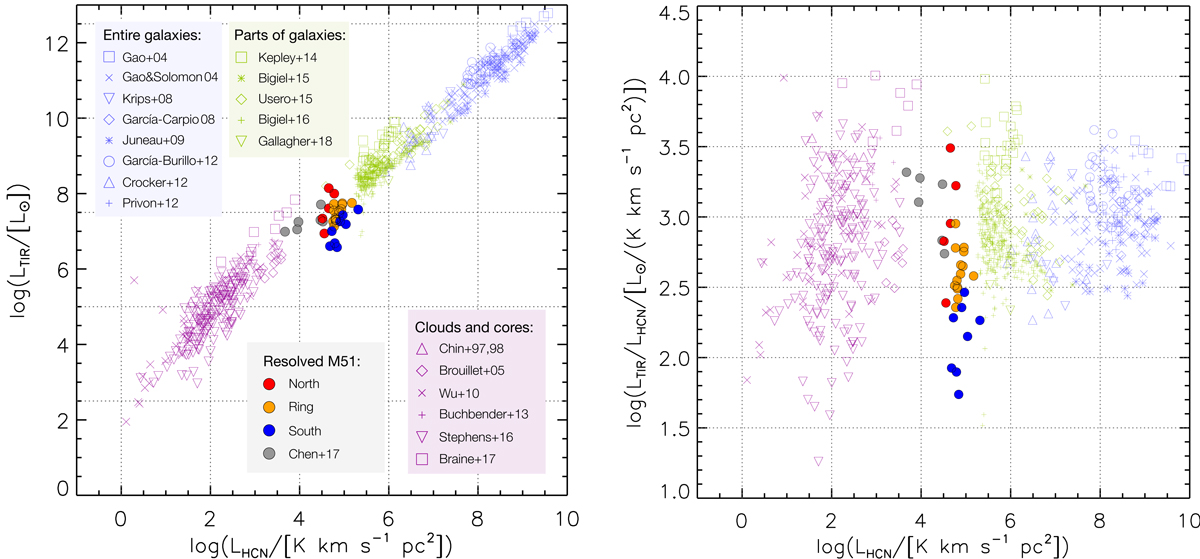
Left: TIR luminosity (8 − 1000 μm), tracing the star formation rate, as a function of HCN luminosity, tracing dense molecular gas. Right: TIR/HCN, tracing the dense gas star formation efficiency, as a function of HCN luminosity. In both panels, we compare against measurements: (a) for whole galaxies (Gao & Solomon 2004a,b; Graciá-Carpio et al. 2008; Krips et al. 2008; Juneau et al. 2009; Crocker et al. 2012; García-Burillo et al. 2012; Privon et al. 2015); (b) kpc-size parts of galaxies (Kepley et al. 2014; Usero et al. 2015; Bigiel et al. 2015, 2016; Gallagher et al. 2018a); (c) resolved clouds and cores (Chin et al. 1997, 1998; Brouillet et al. 2005; Wu et al. 2010; Buchbender et al. 2013; Stephens et al. 2016; Braine et al. 2017). Our new datapoints in M 51 at 3″ resolution (∼100 pc) are displayed as filled circles, while the gray circles show similar-scale measurements in the outer spiral arm of M 51 from Chen et al. (2017).
Current usage metrics show cumulative count of Article Views (full-text article views including HTML views, PDF and ePub downloads, according to the available data) and Abstracts Views on Vision4Press platform.
Data correspond to usage on the plateform after 2015. The current usage metrics is available 48-96 hours after online publication and is updated daily on week days.
Initial download of the metrics may take a while.