Fig. 2.
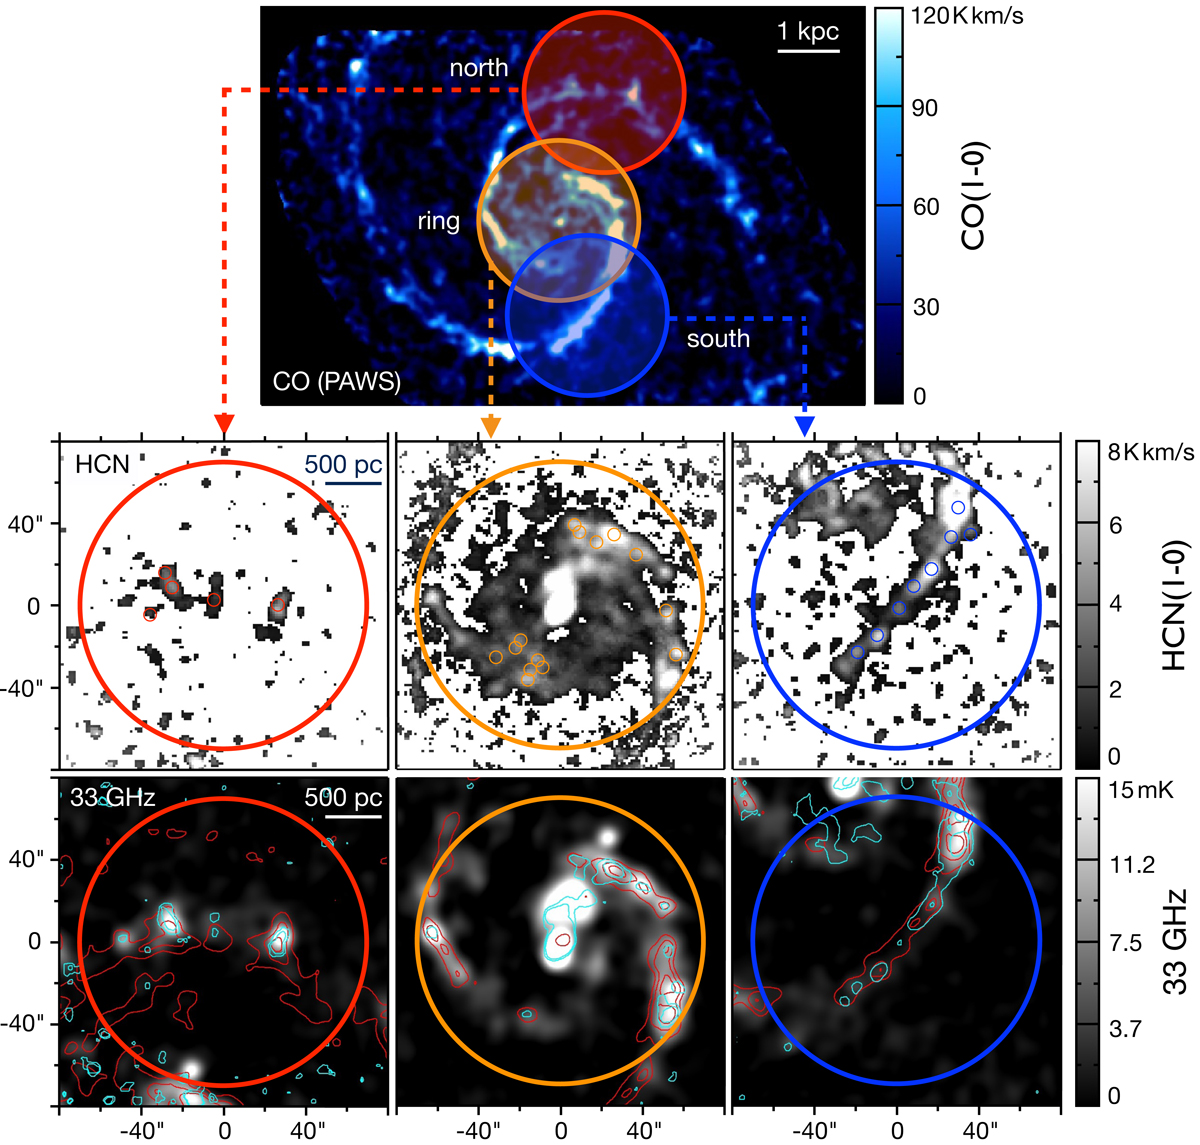
Top: PAWS map of the CO(1–0) line intensity in M 51, highlighting the areas where we have mapped HCN(1–0) and which will be the focus of this paper. Middle panels: zoom on the targeted regions with HCN(1–0) intensity in grayscale, indicating the set of circular apertures centred on HCN peaks, with a diameter of 3″ (FWHM of synthesised beam); the large, thick circles indicate the truncation radius of R = 35″ (the same as the shaded areas in the top panel). Bottom panels: background grayscale map shows the 33 GHz radio continuum, tracing star formation for the same three regions, with contours showing CO emission (red) and HCN emission (cyan); CO contours correspond to [40, 80, 120] K km s−1 for the north, and [100, 150, 200] K km s−1 for the ring and the south, whereas HCN contours represent values of [1.5, 3] K km s−1 for the north, [5.5, 8] K km s−1 for the ring, and [3.5, 10] K km s−1 for the south.
Current usage metrics show cumulative count of Article Views (full-text article views including HTML views, PDF and ePub downloads, according to the available data) and Abstracts Views on Vision4Press platform.
Data correspond to usage on the plateform after 2015. The current usage metrics is available 48-96 hours after online publication and is updated daily on week days.
Initial download of the metrics may take a while.