Fig. 1.
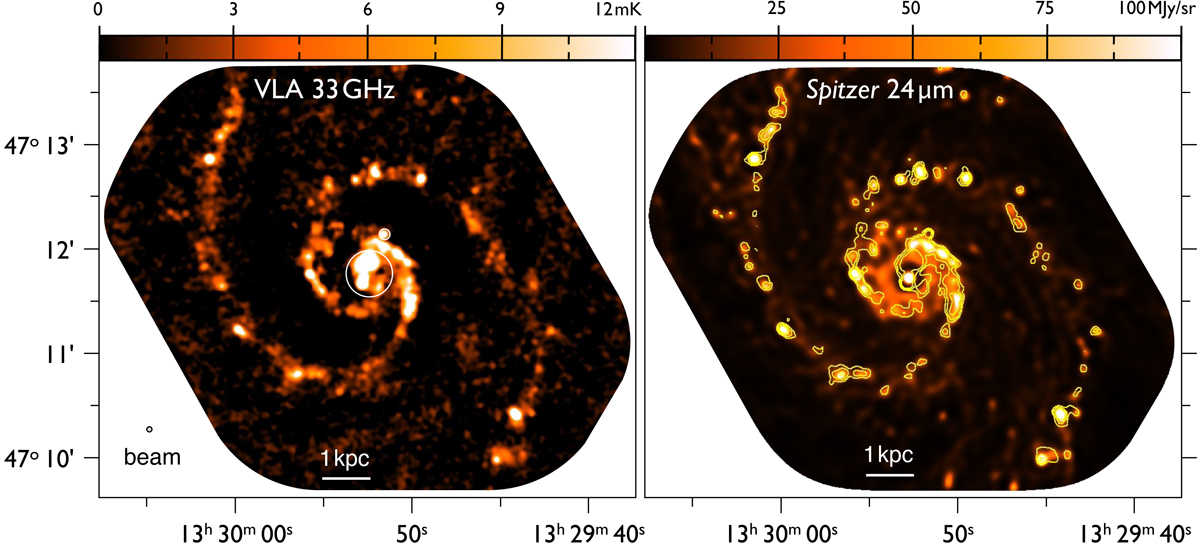
Left: 33 GHz continuum map of M 51 from the VLA at 3″ (125 pc) resolution. The white circles indicate the area affected by the AGN, which we exclude from the analysis. Right: Spitzer/MIPS 24 μm image from Dumas et al. (2011), who deconvolved the PSF, resulting in a map of comparable resolution. The overplotted yellow contours are from the 33 GHz map (levels [3,6,12] mK). The intensity scales of both maps correspond to similar SFR values. The field of view is 300″ × 250″ (∼11 × 9 kpc), with the horizontal axis corresponding to right ascension (east to the left) and the vertical axis to declination (north up), relative to J2000.
Current usage metrics show cumulative count of Article Views (full-text article views including HTML views, PDF and ePub downloads, according to the available data) and Abstracts Views on Vision4Press platform.
Data correspond to usage on the plateform after 2015. The current usage metrics is available 48-96 hours after online publication and is updated daily on week days.
Initial download of the metrics may take a while.