Fig. 6.
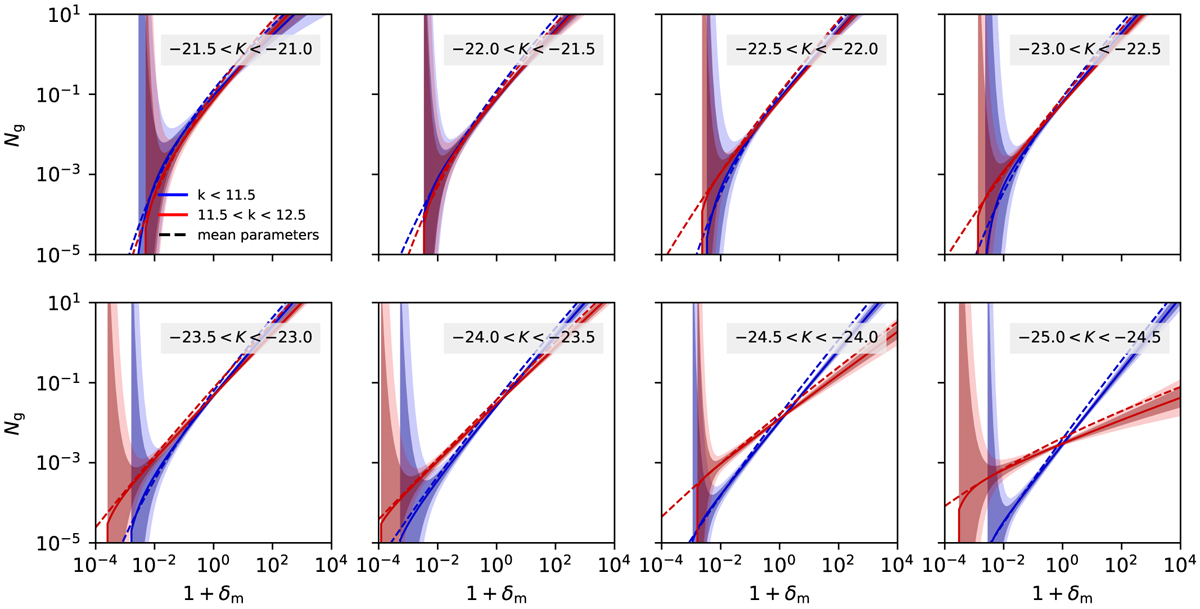
Inferred non-linear bias functions for the 16 galaxy subsets of the 2M++ galaxy compilation in 8 absolute K-band magnitude bins. Blue and red lines correspond to ensemble mean bias functions, while shaded regions indicate the 1σ intervals for the two magnitude cuts as indicated in the upper left panel. Dashed lines correspond to bias functions estimated with the ensemble mean values of the bias parameters.
Current usage metrics show cumulative count of Article Views (full-text article views including HTML views, PDF and ePub downloads, according to the available data) and Abstracts Views on Vision4Press platform.
Data correspond to usage on the plateform after 2015. The current usage metrics is available 48-96 hours after online publication and is updated daily on week days.
Initial download of the metrics may take a while.