Fig. 5.
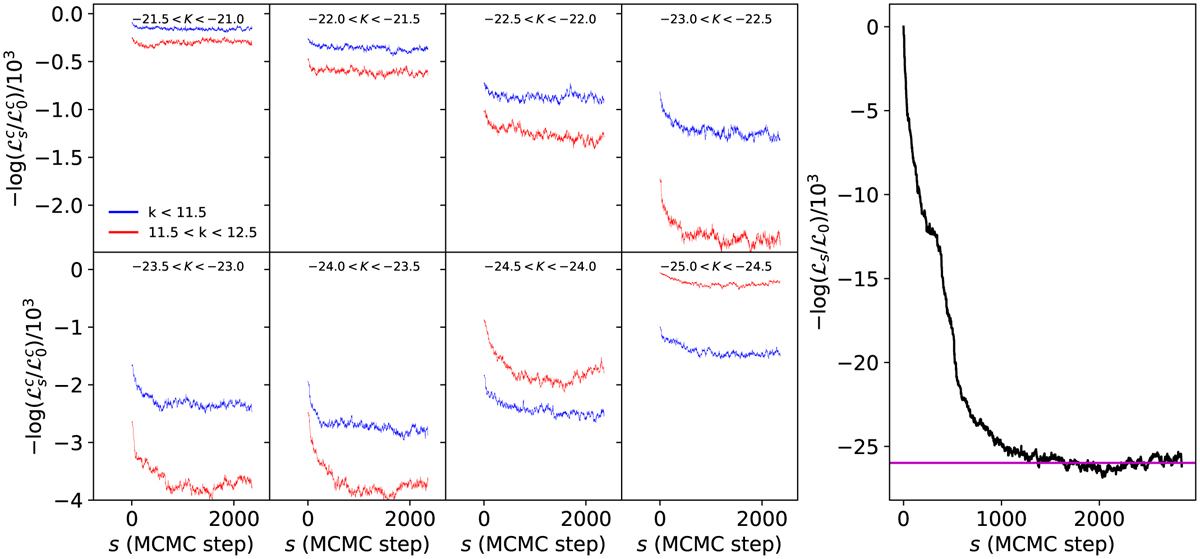
Trace plot of the negative differential logarithmic likelihood as a function of sampling steps n. The values represent logarithm of the ratios between the initial likelihood value obtained by the last sample calculated with a LPT model and subsequently evaluated particle mesh models. Right panel: trace of the total likelihood, while left panels: evolution of logarithmic likelihoods for the respective galaxy sub-catalogues as indicated in the panels. It can be seen that the Markov chain starts initially with high values for the negative logarithmic likelihood but successive sampling steps improve the consistency of inferred three-dimensional initial density fields with the observations. After 1200 steps the trace plot settles at an average value for the negative logarithmic likelihood. In terms of Bayesian odds ratios when comparing the initial guess to a sample at sampling step 2500 this is an improvement of about five orders of magnitude in logarithmic likelihood.
Current usage metrics show cumulative count of Article Views (full-text article views including HTML views, PDF and ePub downloads, according to the available data) and Abstracts Views on Vision4Press platform.
Data correspond to usage on the plateform after 2015. The current usage metrics is available 48-96 hours after online publication and is updated daily on week days.
Initial download of the metrics may take a while.