Fig. 4.
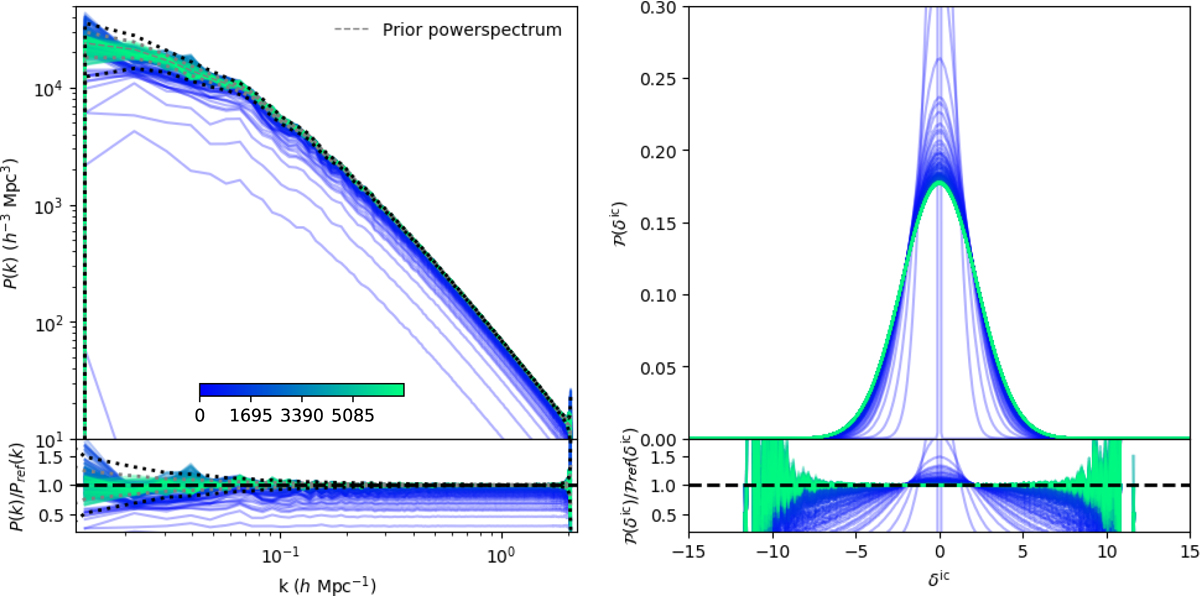
Sequential posterior power-spectrum (left panel) and 1-pt distribution (right panel) of inferred primordial fluctuations measured during the burn-in of the Markov chain with an LPT model. The colour gradient indicates the step number in the chain from zero (random initial condition of small amplitude) to 6783 for which the chain is manifestly stable according to this metric. Top panels: power spectrum and 1-pt distributions measured a posteriori from the samples, while lower panels: ratio of these quantities to the expected prior values. Thick dashed lines represent the fiducial prior values. The thin (black respectively) grey dotted line indicates the Gaussian 1σ limit (2σ respectively) in the lower left panel. These results show no sign of any residual systematic artefacts, indicating a healthy burn-in behaviour of the chain.
Current usage metrics show cumulative count of Article Views (full-text article views including HTML views, PDF and ePub downloads, according to the available data) and Abstracts Views on Vision4Press platform.
Data correspond to usage on the plateform after 2015. The current usage metrics is available 48-96 hours after online publication and is updated daily on week days.
Initial download of the metrics may take a while.