Fig. 3.
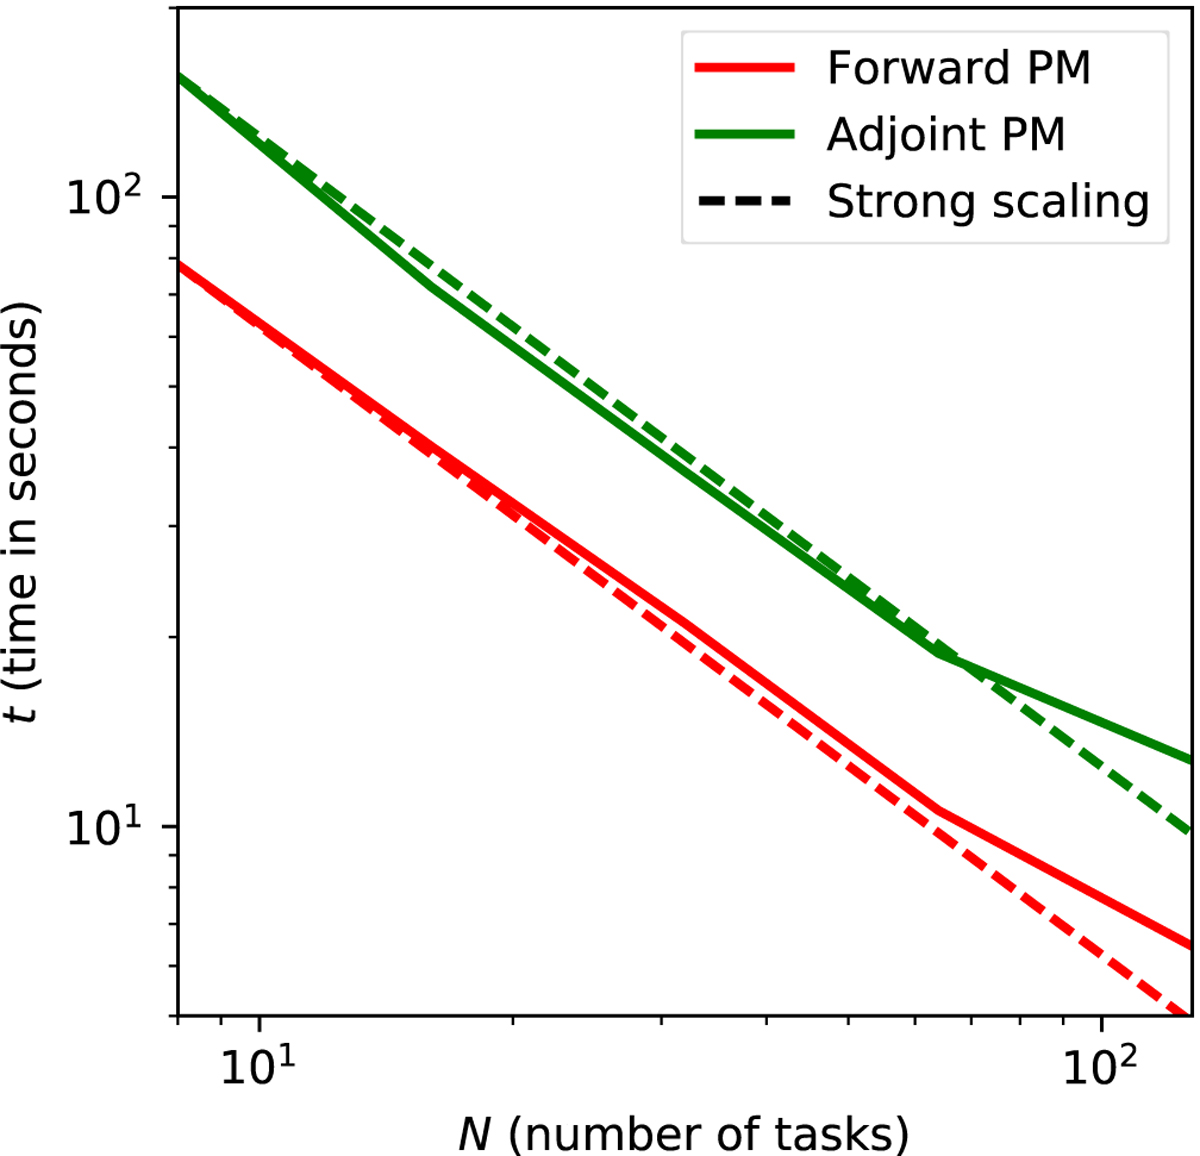
Computational scaling properties of the code over MPI-tasks. The x-axis is the number of MPI tasks, each task being given eight cores with OpenMP parallelization. The y-axis is the wall time seconds taken by the software to execute the indicated part of the algorithm. The red lines correspond to the evaluation of one time-step of the BORG-PM forward model, that is the N-body simulation including gravity solver. The green lines correspond to the time taken to compute the adjoint gradient of that same model. We note that the cost of the adjoint gradient takes only twice as much time as the forward model itself over the entire range. Also, the scaling is strong up to ∼100 cores, the break visible at the end being because of the core saturation and the use of hyper-threading on the supercomputer.
Current usage metrics show cumulative count of Article Views (full-text article views including HTML views, PDF and ePub downloads, according to the available data) and Abstracts Views on Vision4Press platform.
Data correspond to usage on the plateform after 2015. The current usage metrics is available 48-96 hours after online publication and is updated daily on week days.
Initial download of the metrics may take a while.