Fig. 2.
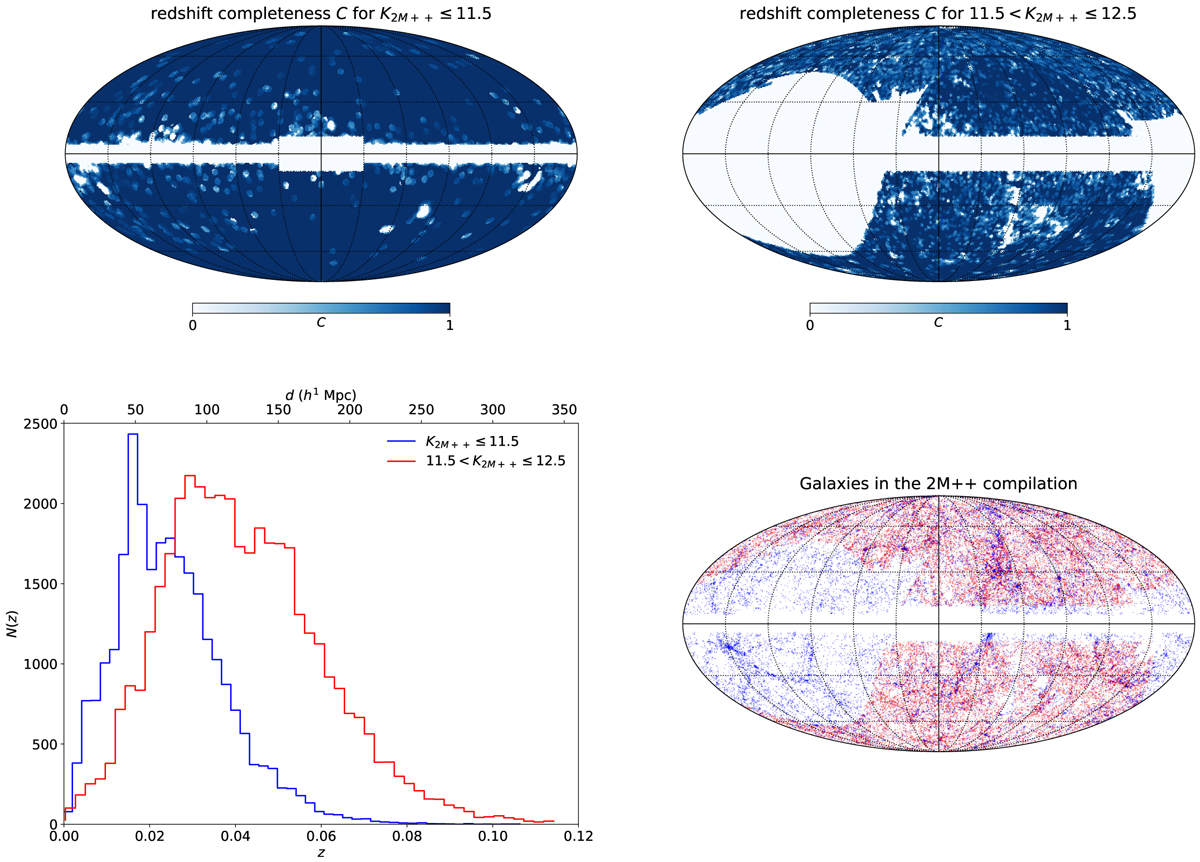
2M++ data and its selection properties. Top left panel: sky completeness at K2M + + ≤ 11.5, derived as the number of observed redshifts versus the number of targets in the 2MASS photometric sample. Top right panel: same quantity is shown but for apparent magnitudes 11.5 < K2M + + ≤ 12.5. Bottom left panel: number count of galaxies in thin radial shells for the two different magnitude cuts shown in the top row. We see that the catalogue covers a volume up to a redshift z ∼ 0.06 − 0.08. Bottom right panel: sky projection of the positions of the galaxies of the 2M++ catalogue. The local large-scale structures are clearly visible.
Current usage metrics show cumulative count of Article Views (full-text article views including HTML views, PDF and ePub downloads, according to the available data) and Abstracts Views on Vision4Press platform.
Data correspond to usage on the plateform after 2015. The current usage metrics is available 48-96 hours after online publication and is updated daily on week days.
Initial download of the metrics may take a while.