Fig. 16.
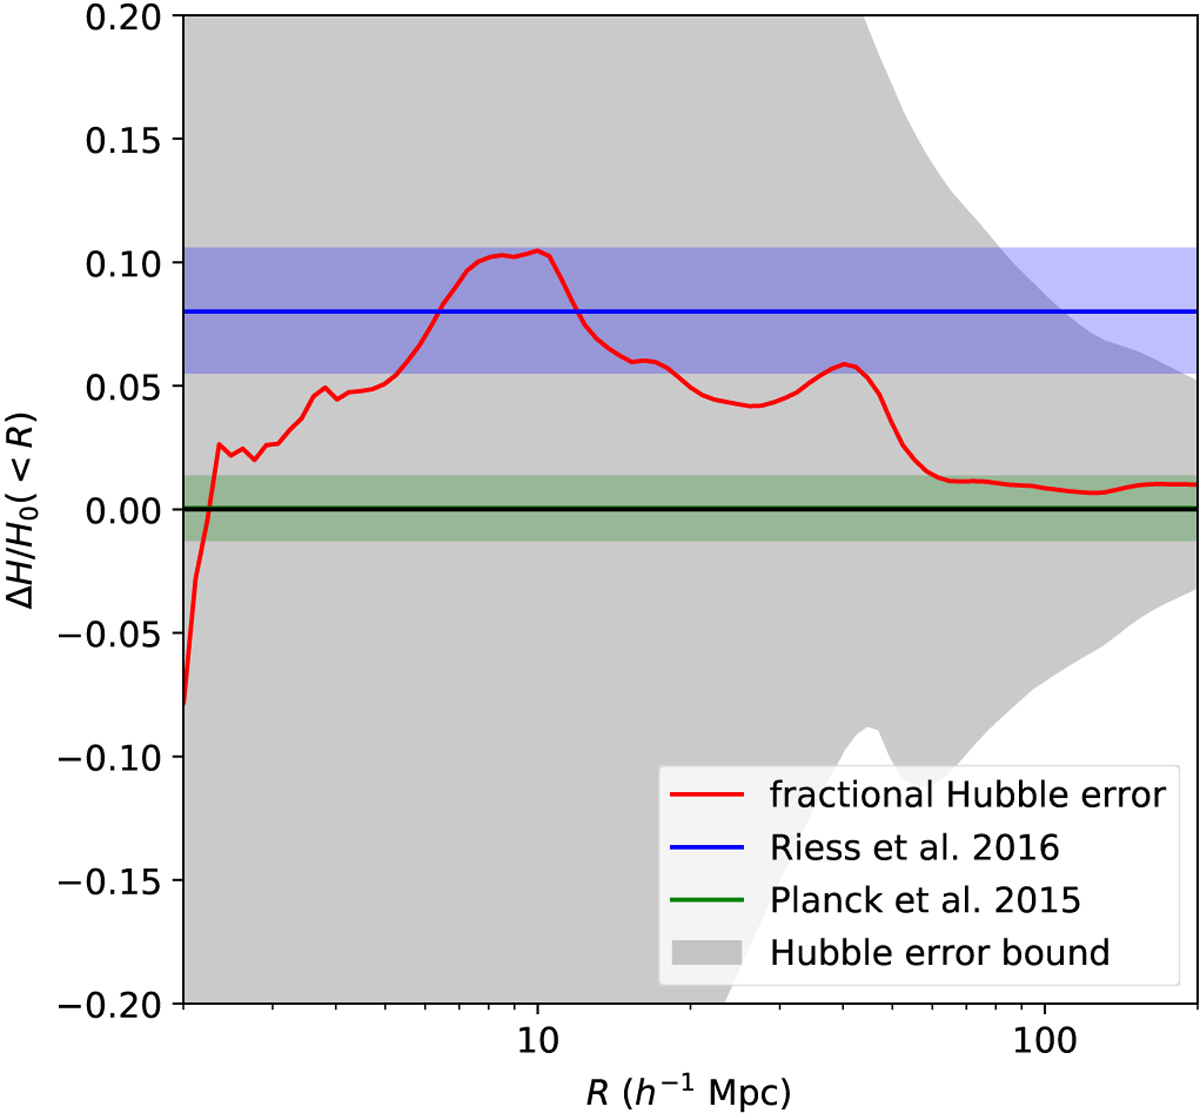
Possible biases arising from doing a Hubble measurement with tracers within some volume, neglecting complex cosmic flows effect. We show in red solid line the mean systematic bias for a Hubble measurement per tracer located within a sphere of radius R. The grey area corresponds to the expected 1σ fluctuation per tracer of that same measurement. We show, for reference, the measurement by Riess et al. (2016; in blue and shade of blue for the 1σ limit) of the Hubble constant relatively to the Planck one (centred on zero, and shade of green for the 1σ limit).
Current usage metrics show cumulative count of Article Views (full-text article views including HTML views, PDF and ePub downloads, according to the available data) and Abstracts Views on Vision4Press platform.
Data correspond to usage on the plateform after 2015. The current usage metrics is available 48-96 hours after online publication and is updated daily on week days.
Initial download of the metrics may take a while.