Fig. 14.
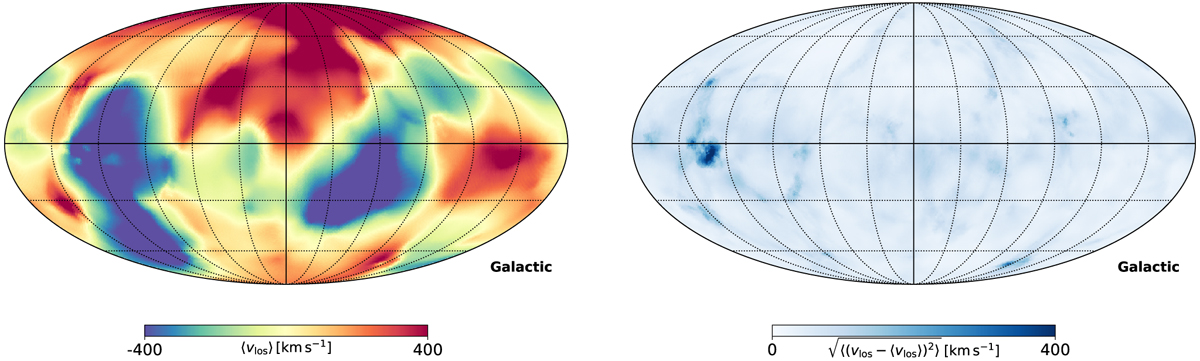
Spherical slice through the inferred three dimensional ensemble mean velocity field (left panel) and corresponding variance field (right panel). Specifically the plot shows the line of sight component of the velocity field. As indicated by the colour bar, in the left panel regions indicated in red are receding from the observer while blue regions are approaching the observer. The plot also shows regions of zero velocity along the line of sight indicating that matter in these regions follows the Hubble flow. Right panel: corresponding variance field for the line of sight velocity component.
Current usage metrics show cumulative count of Article Views (full-text article views including HTML views, PDF and ePub downloads, according to the available data) and Abstracts Views on Vision4Press platform.
Data correspond to usage on the plateform after 2015. The current usage metrics is available 48-96 hours after online publication and is updated daily on week days.
Initial download of the metrics may take a while.