Fig. 13.
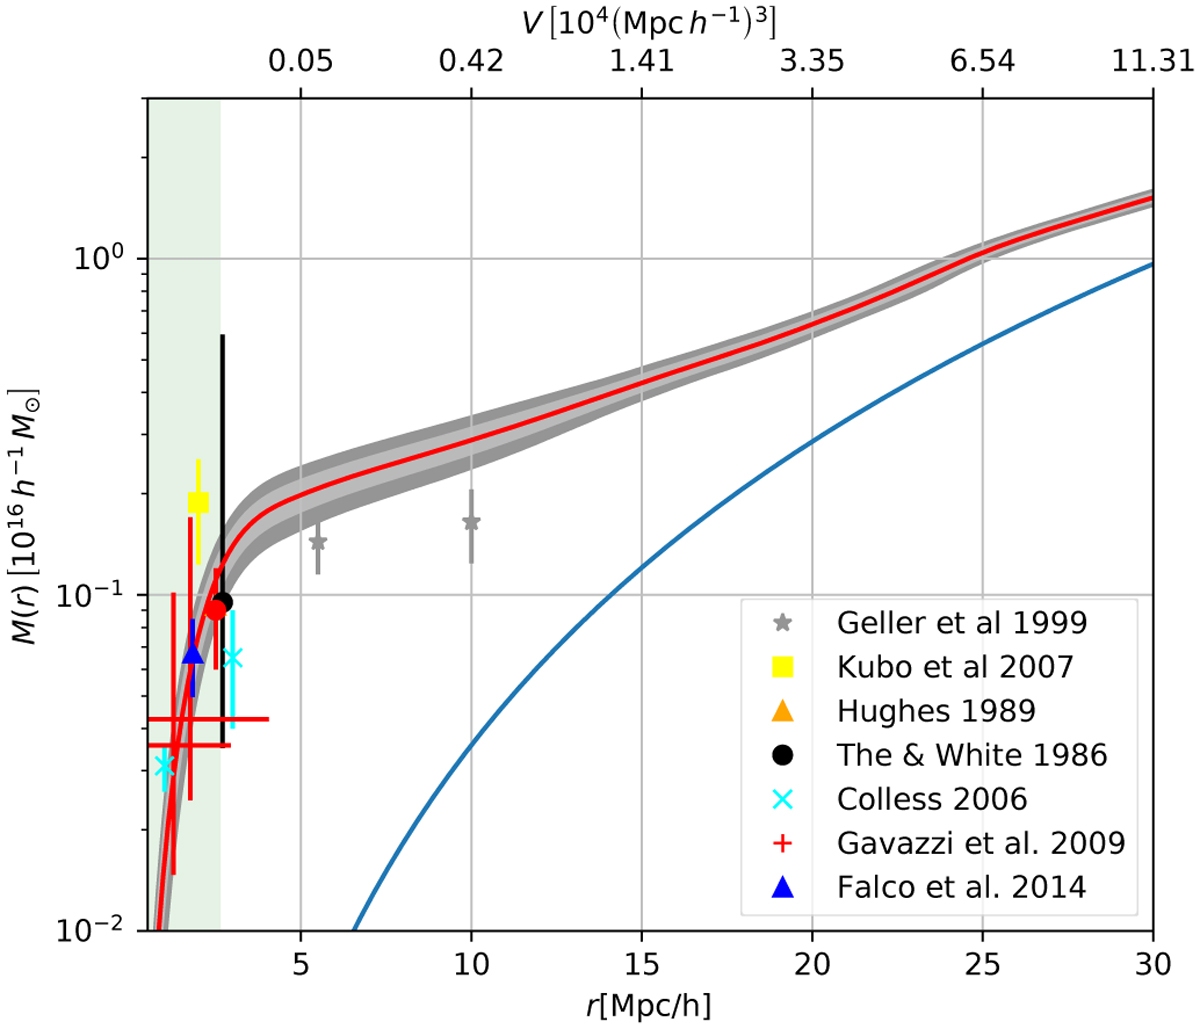
Coma cumulative mass profile. We show here the relation between the distance r and the mass M(< r) enclosed within that radius. The thick solid red line is the mean relation obtained through density field derived using BORG-PM, while the light grey (dark grey respectively) gives the 68% (95% respectively) limit according to that mean. The thin blue solid line indicates the profile assuming solely the mean density of the universe. We also compare our results with the findings in the literature as indicated in the plot. It can be seen that our mass estimate for Coma agrees particularly well with complementary measurements of weak gravitational lensing or X-ray observations at scales of a few h−1 Mpc.
Current usage metrics show cumulative count of Article Views (full-text article views including HTML views, PDF and ePub downloads, according to the available data) and Abstracts Views on Vision4Press platform.
Data correspond to usage on the plateform after 2015. The current usage metrics is available 48-96 hours after online publication and is updated daily on week days.
Initial download of the metrics may take a while.