Fig. 10.
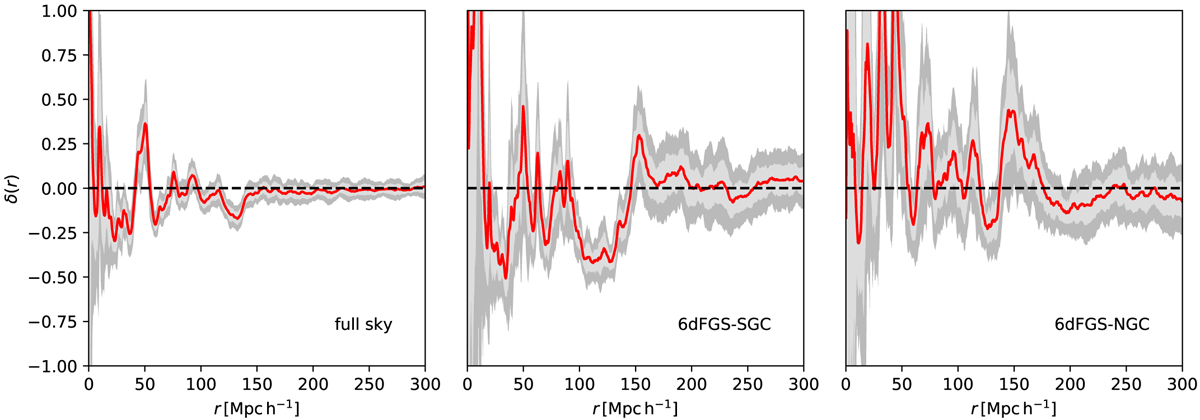
Radial density profiles of matter fluctuations in shells of radius r around the observer. Left panel: spherical shells covering the full sky, while middle and right panel: density fluctuations for the 6dFGS-SGC and 6dFGS-NGC region, as defined in Whitbourn & Shanks (2014), respectively. Red lines indicate our ensemble mean estimate, while dark and light grey shaded regions indicate the 2σ and 1σ limit, respectively. The black dashed line corresponds to cosmic mean density. As can be seen our inference results do not indicate striking evidence for a large scale under-dense region using the 2M++ data.
Current usage metrics show cumulative count of Article Views (full-text article views including HTML views, PDF and ePub downloads, according to the available data) and Abstracts Views on Vision4Press platform.
Data correspond to usage on the plateform after 2015. The current usage metrics is available 48-96 hours after online publication and is updated daily on week days.
Initial download of the metrics may take a while.