Fig. 7.
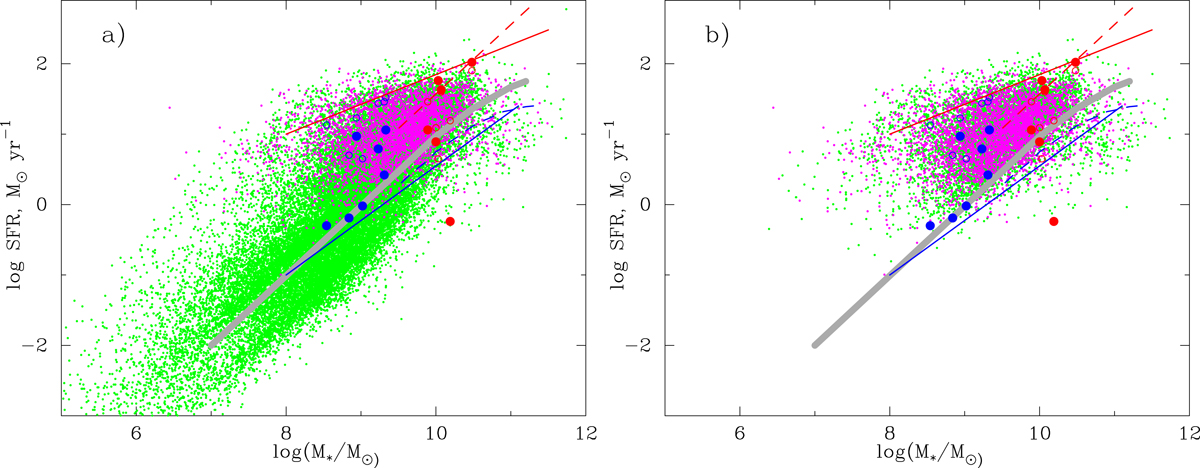
Panel a: log SFR vs. log(M⋆/M⊙) for our Mg II sample (purple dots). Additionally, the entire SDSS DR14 sample of low-metallicity star-forming galaxies (∼30 000) is shown by green dots. The same is also shown in panel b, but galaxies with redshift z < 0.3 are excluded from the entire SDSS DR14 sample. Mg II and Fe II* emitters from the Ultra Deep Field, UDF-10, by Finley et al. (2017) are shown by large symbols. In particular, Mg II emitting galaxies are denoted by large blue filled circles (where SFR values are obtained from SED fitting) and by open circles (where SFR values are obtained from the luminosity of [O II] lines). Thick grey lines represent the main sequence of star-forming galaxies from Finley et al. (2017), who used the results of Schreiber et al. (2015) and Whitaker et al. (2014) and extrapolated their data into a parameter space with no data for low M⋆. For comparison, we also show the observed data and extrapolations to lower masses for star-forming galaxies from Whitaker et al. (2012) ([0.0 < z < 0.5] and [2.0 < z < 2.5]). In both panels the solid red and blue lines represent the relations for high- and low-redshift galaxies by Whitaker et al. (2012). We also plot the data and extrapolations from Schreiber et al. (2015) by dashed red [3.5 < z < 5.0] and dashed blue [0.3 < z < 0.7] lines.
Current usage metrics show cumulative count of Article Views (full-text article views including HTML views, PDF and ePub downloads, according to the available data) and Abstracts Views on Vision4Press platform.
Data correspond to usage on the plateform after 2015. The current usage metrics is available 48-96 hours after online publication and is updated daily on week days.
Initial download of the metrics may take a while.