Fig. 6.
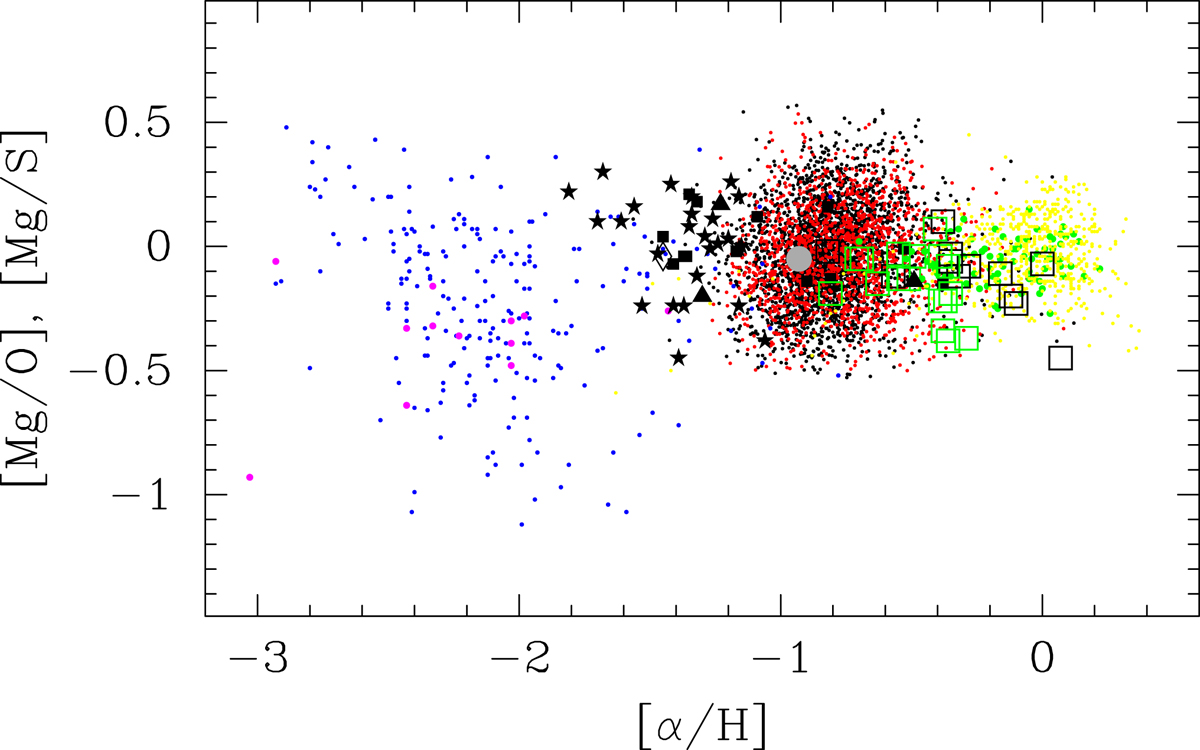
[Mg/O] – [α/H] relations. [Mg/O] vs. [O/H] for star-forming galaxies from this paper, corrected for dust depletion ([Mg/O] + 0.26 for the semi-empirical and [Mg/O] + 0.28 for the Te method) are shown by red and black dots, as in Fig. 1a. All data for stars collected from the literature are presented in [Mg/O] – [O/H] relations. More specifically, for halo and disk Galactic stars from Roederer et al. (2014) (blue dots), Lai et al. (2008) (purple dots), Chen et al. (2000) (green dots), and Bensby et al. (2014) (yellow dots) are also presented. Giant stars in the Milky Way satellite dwarf galaxies by Bonifacio et al. (2004), Sbordone et al. (2007) are shown by large black and green open squares, respectively. Red giant branch stars in the centre of the Sculptor dwarf galaxy by Hill et al. (2018) are shown by black filled stars. [Mg/O] vs. [O/H] or [Mg/S] vs. [S/H] in the interstellar medium is represented by DLAs (filled black squares, De Cia et al. 2016), by GRB-DLAs (filled black triangles, Wiseman et al. 2017), and averaged over many DLAs (filled grey circle, Guseva et al. 2013).
Current usage metrics show cumulative count of Article Views (full-text article views including HTML views, PDF and ePub downloads, according to the available data) and Abstracts Views on Vision4Press platform.
Data correspond to usage on the plateform after 2015. The current usage metrics is available 48-96 hours after online publication and is updated daily on week days.
Initial download of the metrics may take a while.